
Fig. 1.
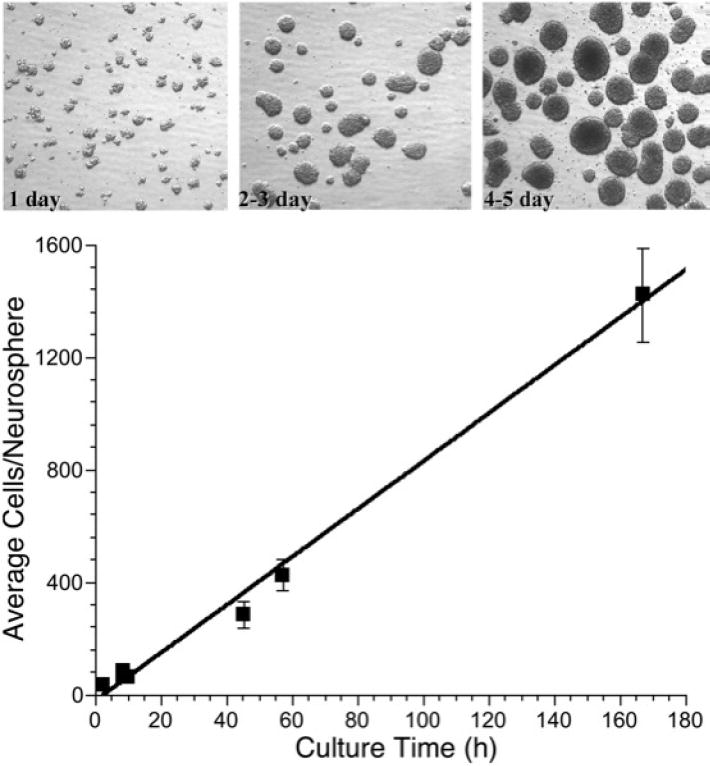
Photomicrographs (60X) of neural precursor cell neurospheres (top) as a function of time in culture, showing progressively larger size. Quantitative assessment of the numbers of cells/neurosphere as a function of time in culture shows a linear response over 7-8 days (bottom).