Figure 5.
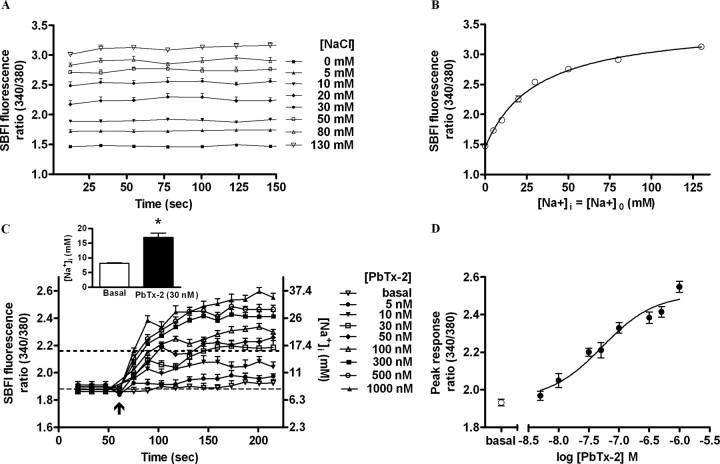
PbTx-2 increases intracellular sodium levels in DIV-2 cerebrocortical neurons. A, In situ calibration of SBFI fluorescence ratio (340 of 380). Time–response data show stepwise changes in SBFI fluorescence ratio values evoked by successive increments in extracellular sodium ion concentration. B, Three parameter hyperbolic curve fit adequately describes calibration data. SE bars are contained within each data point. C, Time–response profile for PbTx-2-induced [Na+]i elevation as represented by the SBFI fluorescence ratio. Data represent the mean ± SEM of three separate experiments, each with six to eight replicates. The scale on the right ordinate depicts the calibrated [Na+]i corresponding to SBFI fluorescence ratio values. The basal [Na+]i was found to be 8.1 ± 0.32 mm. A maximum elevation of [Na+]i to 16.9 ± 1.5 mm was determined after addition of PbTx-2 (30 nm) corresponding to a [Na+]i increment of 8.8 ± 1.8 mm. (*p < 0.001, unpaired t test). D, Nonlinear regression analysis of the PbTx-2 concentration–response data (EC50 = 43.3 nm; 23.5–79.9 nm, 95% CI).

