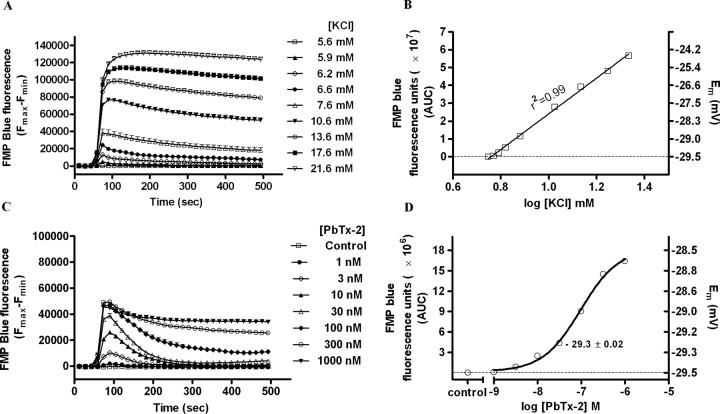
Figure 6.
PbTx-2-evoked change in membrane potential in DIV-2 cerebrocortical neurons. A, Concentration–response profile for KCl-evoked FMP blue fluorescence change as a function of time. Each point represents mean ± SEM of 12 values. Experiment was repeated three times on independent cultures. B, The integrated time–response data for the increment in FMP blue fluorescence (AUC) was plotted as a function of K+ concentration. The displayed regression and correlation coefficient (r2 = 0.998) were derived from linear regression analysis. The right ordinate scale shows membrane potential for each [K+] which was calculated using Goldman–Hodgkin–Katz equation as described in Materials and Methods. The resting membrane potential was −29.5 ± 0.01 mV. C, Concentration–response of PbTx-2-induced changes in membrane potential as determined by changes in FMP blue fluorescence. Each point represents the mean ± SEM of 12 values. This experiment was repeated three times on independent cultures. D, Nonlinear regression analysis of the integrated time–response data for the increment in FMP blue fluorescence (AUC) as a function of PbTx-2 concentration. The membrane potential values were determined by performing K+ calibration regressions in the same culture plate. The membrane potential change evoked by 30 nm PbTx-2 was 0.2 ± 0.02 mV.

