Figure 2.
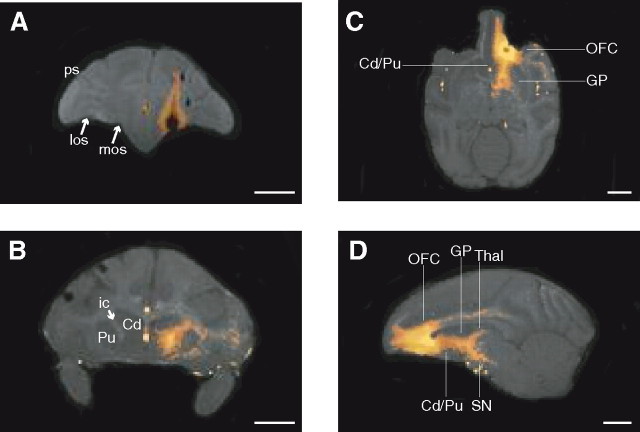
Manganese transport images after injections of high-concentration (800 mm) MnCl2 into OFC of monkey P. All images acquired at 4.7 T with 0.5 mm3 resolution (TR, 100 ms; TE, 3.5 ms; flip angle, 45°). Mn2+-related signal enhancements resulting from shortened T1 were easily seen as bright white voxels. These voxels have been highlighted using the “Fire” color lookup table from NIH ImageJ (Abramoff et al., 2004). A, The injection site within 3 h of the MnCl2 injection, in the coronal plane. The central portion of the injection site appears black because of the very short T2 that occurs in areas of very-high-concentration Mn2+. The injection site covered most of OFC area 13 and extended into the white matter directly above OFC. los, Lateral orbital sulcus; mos, medial orbital sulcus; ps, principal sulcus. B, Postinjection day 4. Mn2+ transport from OFC to ventrolateral caudate (Cd) and ventromedial putamen (Pu) via the internal capsule (ic), in the coronal plane. C, Postinjection day 4. Mn2+ transport from OFC to striatum via the internal capsule, in the horizontal plane. Thin lines indicate rostrocaudal levels of the OFC injection site, Cd/Pu, and globus pallidus (GP). D, Postinjection day 4. Mn2+ transport throughout the orbitofrontal–striatal–thalamic loop, in the sagittal plane. Thin lines indicate rostrocaudal levels of the OFC injection site, caudate–putamen, globus pallidus, substantia nigra (SN), and thalamus (Thal). Scale bars, 10 mm.

