
Figure 5.
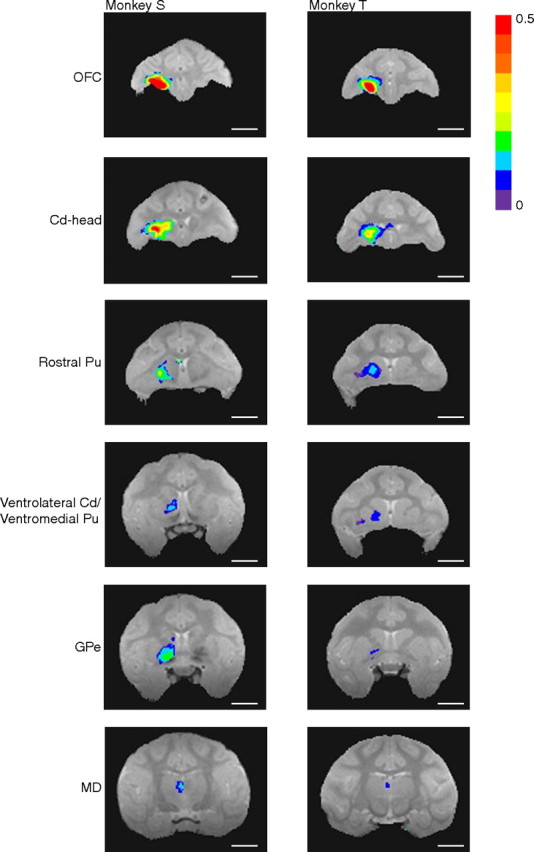
Manganese transport on postinjection day 2, after isotonic MnCl2 injections into OFC of monkeys S and T. Signal intensity maps show enhancements ipsilaterally in OFC, in the head of the caudate nucleus (Cd-head) and rostral putamen (Pu), in ventrolateral caudate, ventromedial putamen, globus pallidus externa (GPe), and mediodorsal nucleus of the thalamus (MD; transport seen in the ventral anterior nucleus of the thalamus in monkey S not pictured). Image acquisition parameters as in Figure 4. Highlighted voxels are those with a statistically significantly greater mean signal intensity in postinjection versus preinjection scans (t test, p ≤ 0.01, all corrected for multiple comparisons except monkey T's GPe and MD images). Colors denote the magnitude of the signal change. Scale bars, 10 mm.