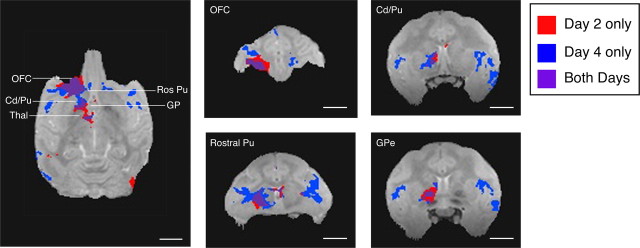
Figure 7.
Manganese transport over time. Topographic distribution of manganese signal on day 2 (red) and day 4 (blue) after injection of isotonic MnCl2 into OFC of monkey S. Purple areas are those in which there was enhanced signal on both postinjection days. Note that subcortical targets of manganese transport overlapped extensively across time. Detection of manganese transport in cortical areas was greater on day 4. These maps do not show the range of signal intensity differences visible in Figures 5 and 6. Thin lines on the horizontal slice indicate rostrocaudal levels of OFC, rostral putamen (Ros Pu), ventrolateral caudate (Cd), ventromedial putamen, globus pallidus (GP), and thalamus (Thal). Scale bars, 10 mm. GPe, Globus pallidus externa.

