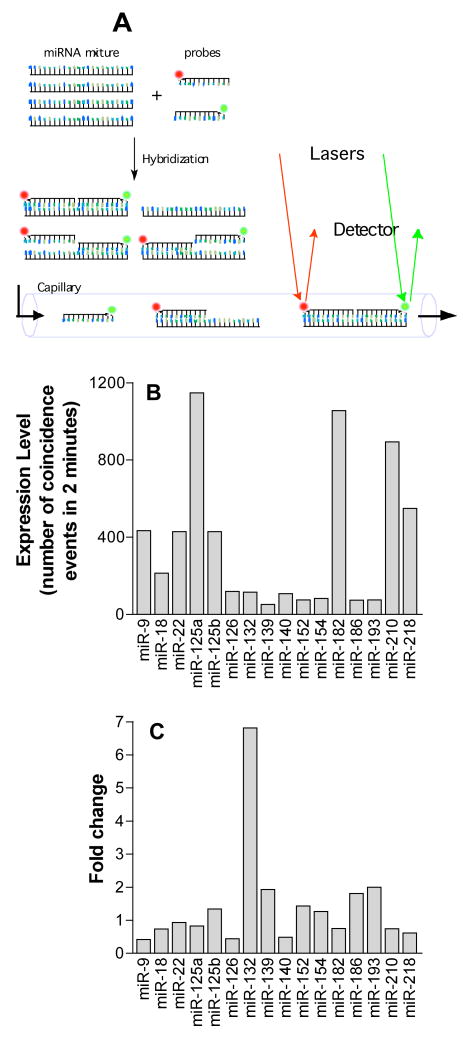
Figure 1.
A. Schematic of single molecule detection assay. A pair of LNA-DNA chimeric oligonucleotide probes complementary to specific miRNA targets were labeled with either Oyster 556 (green) or Oyster 656 (red). The labeled probes were hybridized with miRNA samples from LβT2 gonadotropes, and then were passed through a microfluidic capillary for confocal laser-induced fluorescence detection. Coincidence events of the green and red signals, which represent a single miRNA target molecule, were counted. B. Expression level of 16 miRNAs in control LβT2 cells determined by single molecule detection assay. C. Change in miRNA levels in LβT2 cells following 3 hour GnRH treatment.

