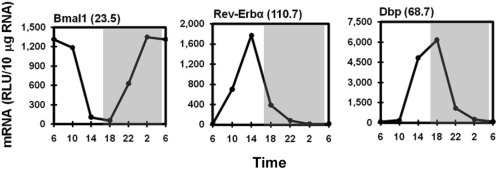
Fig. 1.
Rhythmic transcripts of prototypical circadian oscillators (Bmal1 and Rev-Erbα) and clock-controlled gene (Dbp) in mouse liver. Total RNA from mouse livers (n = 5 per time point) was pooled, and mRNA expression was determined by a multiplex suspension array. Data at 6:00 AM were used twice to graph a 24-h cycle of mRNA expression. Numbers in parentheses next to the gene names indicate the peak/trough ratio of each mRNA. The shaded area of the figure represents the dark phase, and the white area represents the light phase. The same design is also used in the following figures. RLU, relative light units.

