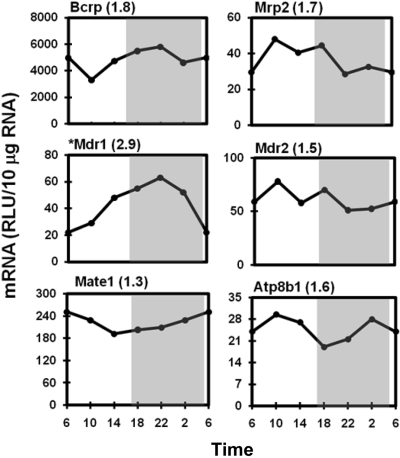
Fig. 10.
Daily mRNA expression profiles of canalicular transporters in mouse liver. Graph presentation follows that outlined in the legend to Fig. 1. *, expression of Mdr1 mRNA was quantified by bDNA assay with 10 μg of pooled RNA (n = 5/time point). RLU, relative light units.

