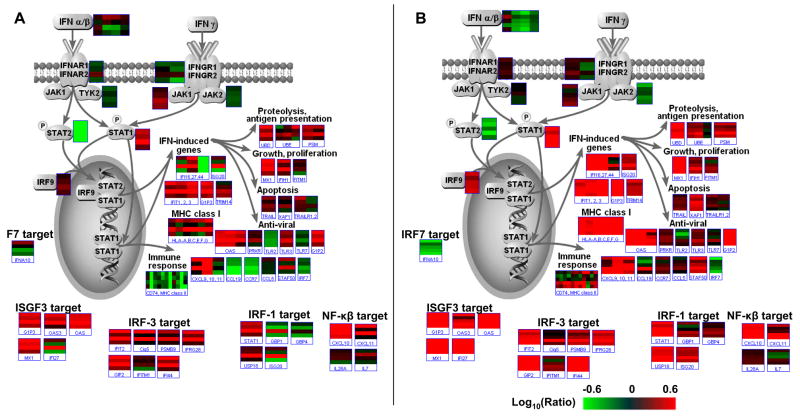
Figure 4.
Induction of IFN-signaling pathways in HCV-infected uPA-SCID mice (A) and patients (B). Pathway Builder (Protein Lounge) and the Pathway feature of Resolver were used to visualize the expression of genes from the IFN signaling pathway. The expression profiles of individual genes are shown in boxes and each bar within the box represents one experiment. Color schemes are as indicated in Figure 1. The reference for each microarray experiment was a pool of normal, uninfected human liver tissue.

