
Figure 1.
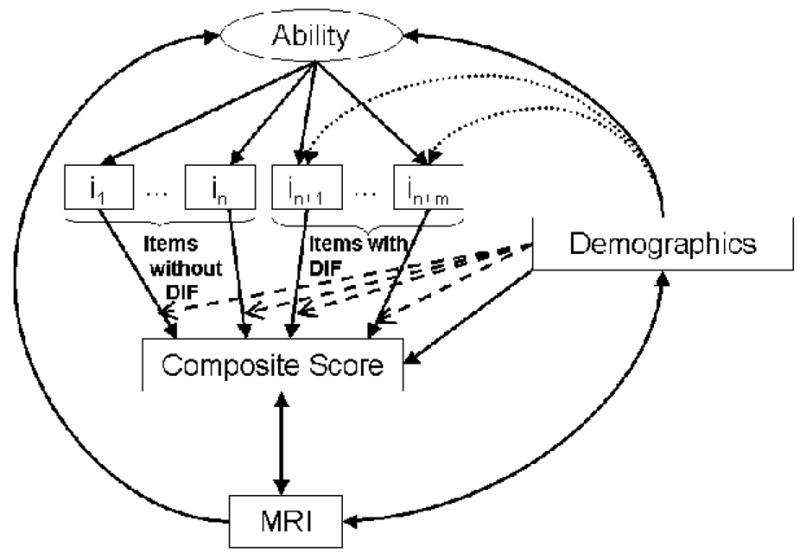
Schematic representation of relationships analyzed in this paper. Ability is represented in an oval at the top. Ability is reflected by item responses on a cognitive test (depicted in boxes as i1 through in+m). Demographic characteristics may directly impact Ability (depicted by the solid arrow between Demographics and Ability) and may be associated with item bias (depicted by the dotted arrows to the items with differential item functioning, abbreviated in the Figure as DIF, specifically items in+1 through in+m). Formulas are used to obtain composite scores from the observed item responses, depicted in the figure by the solid arrows between the item responses and the composite score. Traditional test theoretic composite score formulas include summing up observed responses or summing up average scores. Traditional test theoretic composite score formulas that account for demographic heterogeneity apply the same adjustment to all the items (depicted in the figure as the four dashed arrows extending from Demographicsto the solid arrows extending from all of the items to the composite score). Modern psychometric theory formulas (known as item response theory or IRT) empirically calibrate item difficulty across the range of cognitive ability levels, resulting in non-linear relationships between traditional composite scores and IRT scores. IRT formulas that account for DIF apply adjustments for demographics only to those items found with DIF (depicted in the figure with the rightmost two dashed arrows extending from Demographicsto the solid arrows extending from items in+1 through in+m to the composite score). Finally, we compared these composites based on their strength of relationship with MRI measures of white matter hyperintensity and total brain volume. These evaluations included scale-level accounting for demographic heterogeneity, indicated in the figure by the solid arrow extending from Demographics to the composite score and the double headed arrows between the composite score and MRI, and between MRI and demographics. Note that measurement error is not depicted in the Figure.