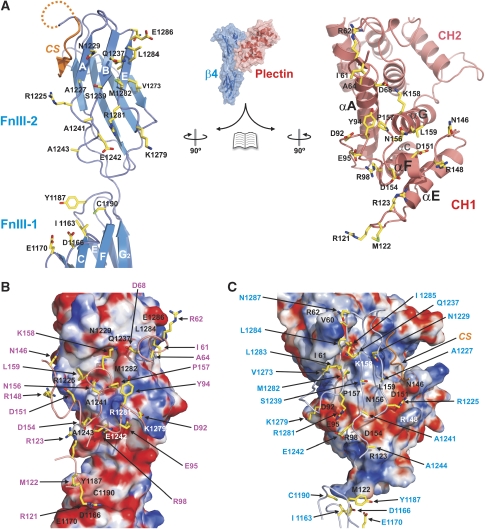
Figure 2.
Integrin β4–plectin interface. (A) Open-book view of the complex. Ribbon representation of the β4 (left) and plectin (right) structure with residues that constitute the interface shown as sticks. (B, C) Surface representation coloured by electrostatic potential (from -12 kT/e in red to 12 kT/e in blue) of β4 (B) and plectin (C) in the same orientation as in (A). Residues that form part of the interfaces are labelled on each surface. The backbone of the companion partner is partially shown as a wire, with the side chains that participate in the interaction shown as sticks and labelled with arrows.

