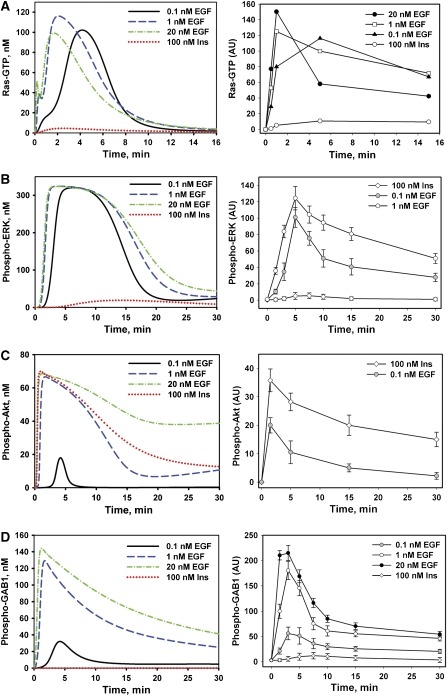
Figure 2.
Dynamics of EGF or insulin-induced Ras-GTP, ERK and AKT activation, and GAB1 phosphorylation. The left panels show the time courses calculated in silico and right panels show the corresponding time courses measured in HEK293 cells stimulated with insulin (Ins, 100 nM) or EGF (0.1, 1 or 20 nM) for the indicated time intervals (min). Active GTP-bound Ras was immunoprecipitated (IP) from total cell lysates (TCL) by the agarose-conjugated Ras-binding domain (RBD) of Raf as described in Materials and methods. Proteins from Ras-IP or TCL were separated on LDS-PAGE (4–12%), transferred to nitrocellulose membrane, and immunoblotted (IB) with anti-Ras (A) or anti-phospho-ERK1/2 (T202/Y204), anti-phospho-AKT (S473) or anti-phospho-GAB1 (Y627) antibodies (B–D), respectively. The signal intensities of phosphorylated ERK1/2, AKT, or GAB1 normalized against the appropriate signal of α-tubulin protein level are expressed in arbitrary units (AU). Data shown are the mean of normalized signal intensities±s.d. from five independent experiments each performed in triplicates.

