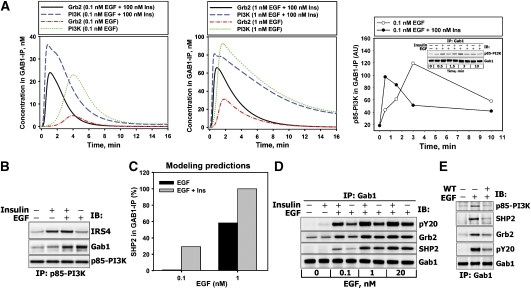
Figure 4.
Association of Grb2, PI3K, or SHP2 with GAB1 in response to EGF, insulin, or their combination. (A) The left and middle panels show simulated dynamics of GAB1-containing complexes (scales on the Y axis are different). The right panel shows quantitation of p85–PI3K in GAB1-IP (see Materials and methods). (B) HEK293 cells were stimulated with 100 nM insulin and/or 1 nM EGF for 1.5 min. p85–PI3K–IP was analyzed for IRS4, GAB1, or p85–PI3K proteins. (C) Modeling predictions of relative SHP2 levels in GAB1-IP at 1.5 min after stimulation with 100 nM insulin and/or 0.1 and 1 nM EGF. (D) HEK293 cells were stimulated with 100 nM insulin and/or 0.1, 1, and 20 nM EGF for 1.5 min. GAB1-IP was analyzed for total phosphotyrosines (pY20), Grb2, SHP2, or GAB1 proteins. (E) HEK293 cells were pretreated with 100 nM WT (+) or equivalent amounts of solvent DMSO (−) for 30 min and stimulated with 1 nM EGF for 3 min. GAB1-IP was analyzed for total phosphotyrosines (pY20), Grb2, SHP2, p85–PI3K, or GAB1 proteins. Representative blots are shown in each panel (n=3).

