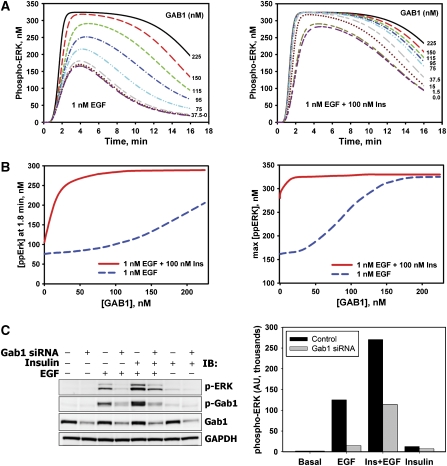
Figure 5.
Effects of GAB1 depletion on ERK activation induced by EGF, insulin, or their combination. (A) Computational analysis of ERK activation kinetics in response to 0.1 nM EGF in the absence (left panel) or presence (right panel) of 100 nM insulin at the indicated levels of GAB1 protein. Time courses are shown for 225 nM (control; black—solid line), 150 nM (red—long dash line), 115 nM (dark yellow—short–long–short dash line), 95 nM (dark pink—long–short–short dash line), 75 nM (green—short dash line), 37.5 nM (blue—dash–dot line), 15.0 nM (cyan—dash–dot–dot line), 1.5 nM (gray—long–short dash line) and 0 nM (dark red—dotted line) GAB1 concentrations. (B) Simulated dependences of phospho-ERK level at 1.8 min (left panel) and maximal phospho-ERK level (right panel) on the GAB1 abundance for cells stimulated with 0.1 nM EGF in the presence (red solid line) or absence (blue dashed line) of 100 nM insulin. (C) HEK293 cells transfected with specific siRNA against GAB1 (+) or non-targeting siRNA (−) were stimulated with 100 nM insulin and/or 1 nM EGF for 1.5 min. Immunoblots were analyzed for phosphorylated ERK1/2 (T202/Y204) or GAB1 (Y627). GAB1 protein levels demonstrate the efficacy of GAB1 suppression. GAPDH was used as a loading control. Representative blot (left panel) and the bar graph of respective numerical values (right panel) are shown.

