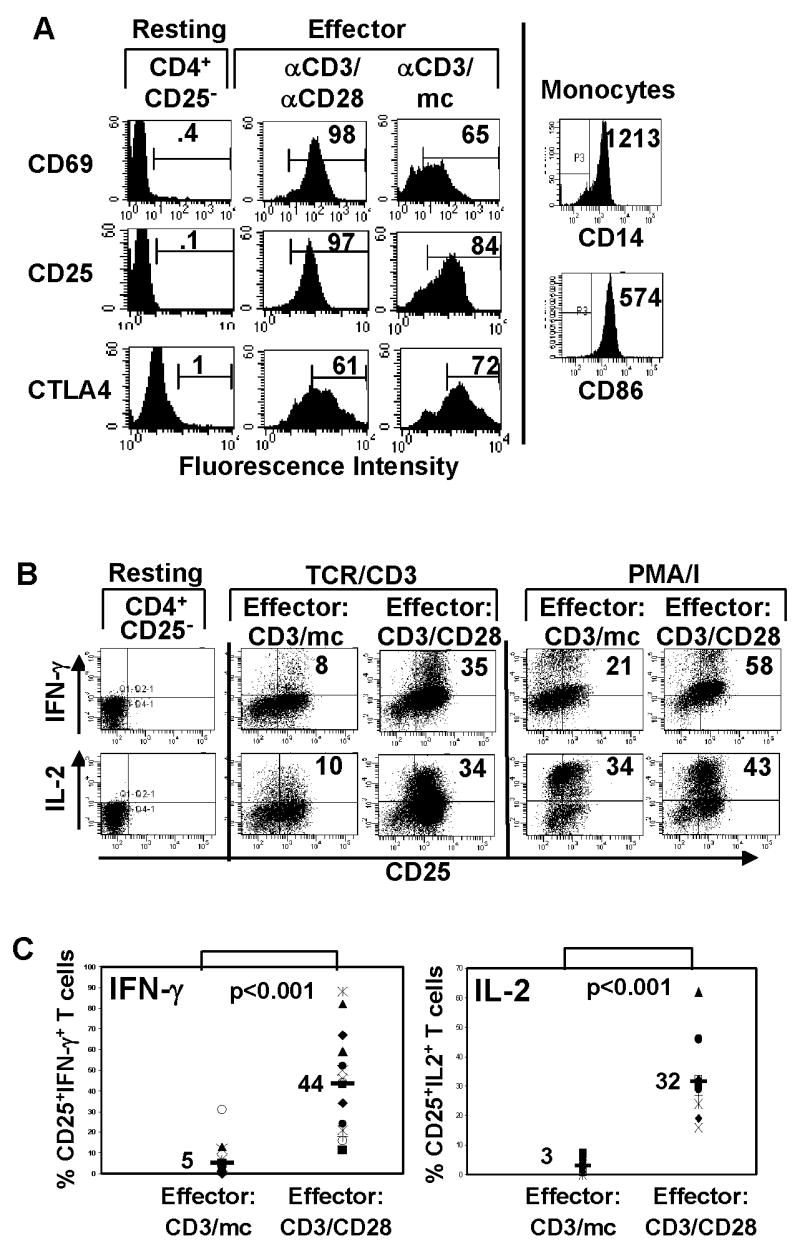
Figure 1. Generation of effector CD4 T cells with distinct functional capacity.

(A) Cell surface CD25, CD69 and intracellular CTLA-4 phenotype of resting CD4+CD25− T cells and those stimulated with anti-CD3/anti-CD28 antibodies (CD3/CD28) or anti-CD3 and monocytes (CD3/mc) gated on live CD4+ T cells. Isolated monocytes were surfaced stained for CD14 and CD86 (B7-2) expression. Data from a single donor are representative of 25 donors. (B) Freshly isolated CD4+CD25− T cells were assessed for IFN-γ and IL-2 production. Activated cells were restimulated with anti-CD3/CD28 antibodies (TCR/CD3) or PMA/ionomycin (PMA/I) for 6 hours in the presence of Golgistop and IFN-γ and IL-2 production determined by ICS. Dot plots show CD25 versus IFN-γ (upper row) or IL-2 expression (lower row) by CD3/mc effector cells and CD3/CD28 effector cells gated on live CD4+ T cells. Number in the upper right quadrant indicates percentage of CD25+ IFN-γ+ or CD25+IL-2+ CD4 T cells. (C) Data from multiple donors (N=15) showing proportion of IFN-γ producers in CD3/mc and CD3/CD28 activated cells. Number in top graph indicates mean IFN-γ production (5±8) for CD3/mc and (44±24) for CD3/CD28 differing with high significance (p<0.001). Bottom graph contains data from multiple donors (N=10) showing proportion of IL-2 producers in CD3/mc and CD3/CD28−activated cells. Number indicates mean IL-2 production (3±2.5) for CD3/mc and (32±13) for CD3/CD28 cells differing with high significance (p<0.001).
