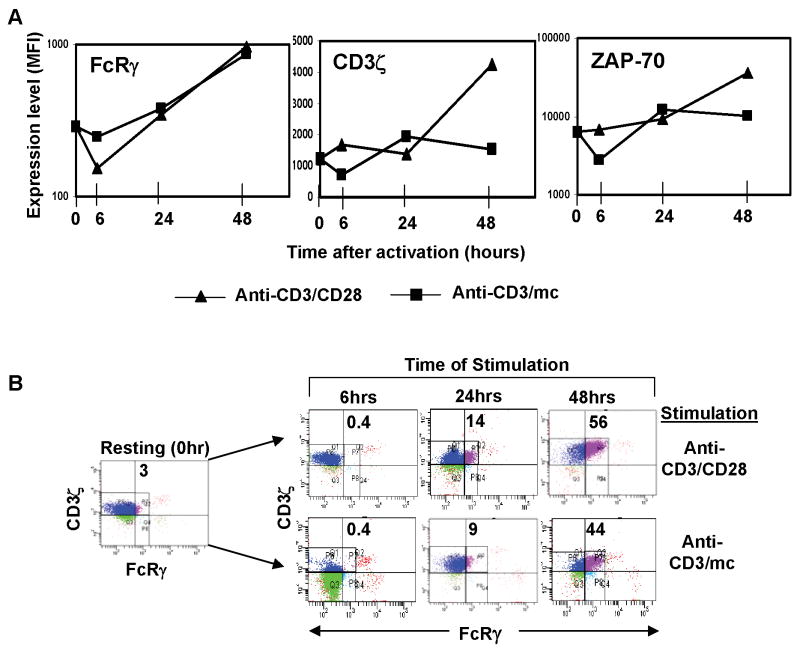
Figure 4. Dynamic alterations in proximal signaling during effector differentiation.
Human CD4+CD25− cells stimulated with anti-CD3/anti-CD28 or anti-CD3/mc were harvested at indicated time-points, surfaced stained for CD4 and CD25 and stained intracellularly for FcRγ, CD3ζ, and ZAP-70 expression. (A) Graphs show change in the mean fluorescence intensity (MFI) depicted on a linear scale for FcRγ and CD3ζ expression and on a log scale for ZAP-70 expression over time following activation with anti-CD3/anti-CD28 antibodies (triangle) or anti-CD3/mc (square). Cells are gated on CD4+ T cells. (B) CD3ζ and FcRγ expression in CD4 T cells activated for 6–48 hours in the anti-CD3/CD28 activated (top panel) and anti-CD3/mc activated cells (bottom panel of dot blots). Number in quadrant indicates percentage of CD3ζ+FcRγ+ cells at each time-point, with quadrants drawn based on isotype-matched controls.

