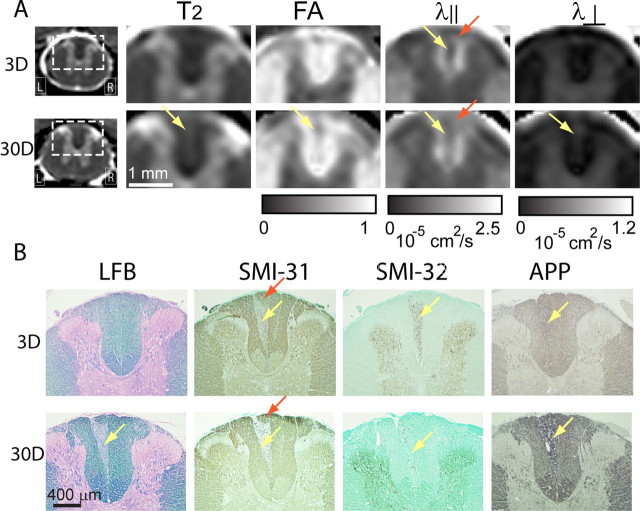
Figure 5.
A, Single-subject axial T2-weighted (T2), FA, parallel diffusivity (λ‖), and perpendicular diffusivity (λ⊥) images of T5 rat spinal cords at 3 and 30 d after dorsal root axotomy. Visible lesions are indicated by the yellow arrows. In the FA, λ‖ and λ⊥ images, only the portion of the dorsal column is shown. In the parallel diffusivity images, a triangular region indicated by the red arrows may contain axons that arise from the dorsal roots caudal to those transected. B, Matching LFB-, SMI-31-, SMI-32-, and APP-stained histological images of T5 rat spinal cord dorsal column at 3 and 30 d after dorsal root axotomy. Red arrows indicate regions that contain axons arise from the uninjured dorsal roots caudal to those transected in this study.

