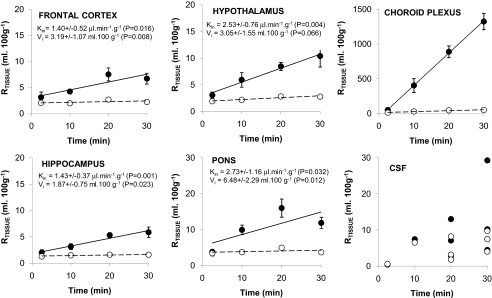
Fig. 1.
Percentage of [3H]pentamidine (—•—) and [14C]sucrose (–○–) detected in samples relative to that in the plasma (RTissue) versus times. Each data point represents n = 3 to 6, except for CSF, where individual points are plotted because of the limited number of samples obtained. The slopes (Kin) and intercepts of the curves (Vi) for [3H]pentamidine distribution into the brain were determined.

