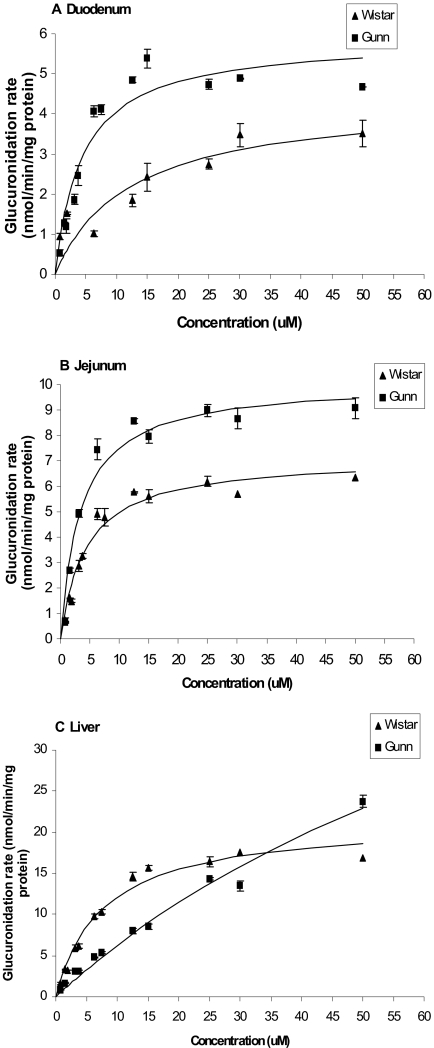
Fig. 5.
Apparent glucuronidation rates of apigenin in rat duodenal (A), jejunal (B), and liver (C) microsomes of Gunn and Wistar as a function of concentration (n = 3). Rates of metabolism were determined from 0.625 to 50 μM, and reaction time was for 30 min. The metabolism rate is the average of three determinations and the error bar represents the S.D. of the mean. The points were observed apigenin glucuronide formation rates, and the curves were estimated based on fitted parameters generated by a simple Michaelis-Menten equation (eq. 6).

