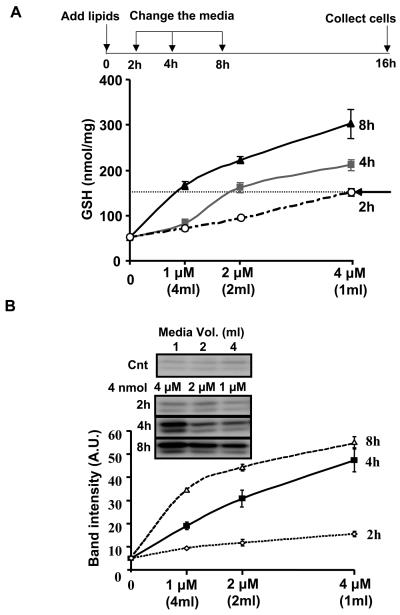
Figure 6. The induction of GSH and HO-1 in response to a constant amount of 15d-PGJ2 with varying concentration.
Panel A: cells were incubated with increasing volume (shown in parenthesis) of media containing the same amount of 15d-PGJ2 at the concentrations shown for 2, 4, 8h (0% FBS) after which the medium was changed (0.5% FBS, 2ml) and the cells incubated for a further 14, 12, and 8h respectively after which cell lysates were prepared. Panel A: The dotted line allows comparison of the conditions needed to achieve the same level of GSH (150 nmol GSH/mg protein) in response to a constant amount (4 nmol) but varying concentrations of 15d-PGJ2. Panel B: HO-1 protein expression. Values are mean ±S.E.M., n=3. Values are mean ±S.E.M., n=3.

