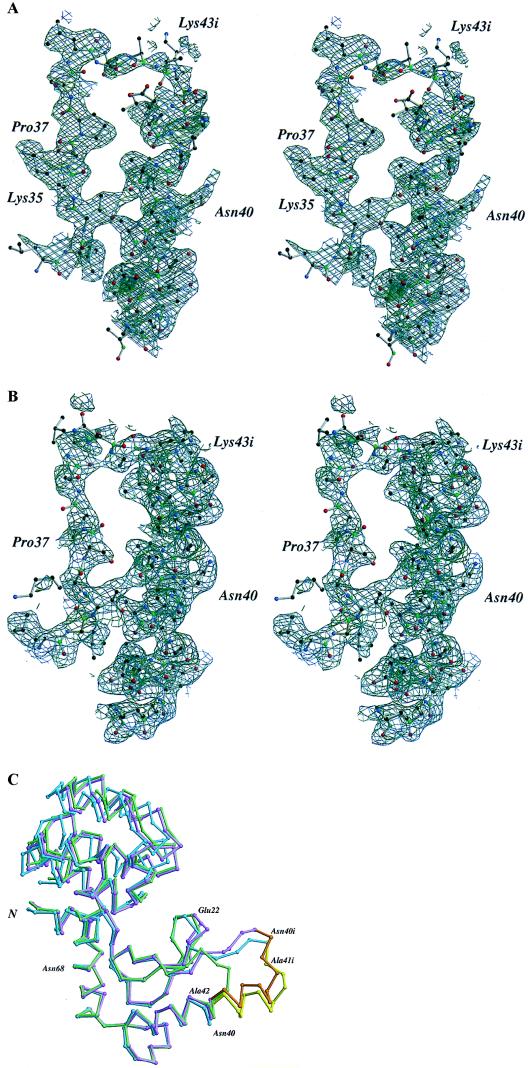
Figure 3.
(A) Map showing the initial electron density for the inserted region of molecule A in space group P21. Amplitudes are (2Fo-Fc) weighted by refmac (15) where the structure factors, Fc, and phases were calculated from the refined model including the inserted region. The map was calculated at 2.5-Å resolution and contoured at 1.0 σ. The density in the vicinity of residues 40i-43i is not well defined and could not be fit by a well-defined model. (B) Electron density for molecule B of crystal form P21. This map was calculated with the same coefficients, contouring, and resolution as in A. (C) Superposition of the Cα trace of the two copies of mutant L20 in crystal form P21 (molecule A, blue; molecule B, mauve) and wild-type T4 lysozyme (green). The sequence of the insert is highlighted in yellow for molecule A and in orange for molecule B. The structural rearrangements of loop 18–25 in molecule B are clearly visible. The superpositions were based on the α-carbon atoms of residues 51–80 within the amino-terminal domain. Because of slight changes in the hinge-bending angle the C-terminal domains appear out of register although the respective structures within these regions are very similar.

