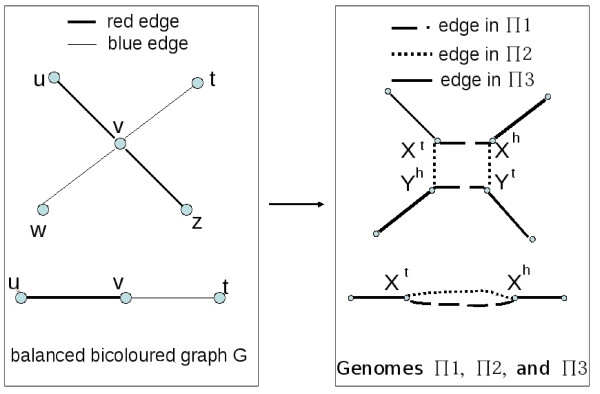
Figure 7.
Reduction of BGD to DCJ median problem. The left hand graph is the balanced bicoloured graph G, and the right hand graph represents the adjacencies of the genomes Π1, Π2 and Π3. Again, in the case of a degree 2 vertex in G, the choice for M is determined. But in the case of a degree 4 vertex in G, either the edges of Π1 or Π2 can be chosen for the median M.

