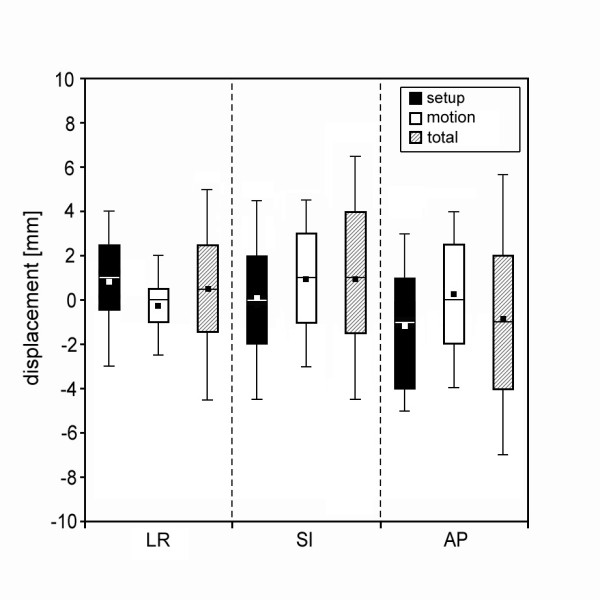
Figure 3.

Measured deviations in LR, SI and AP directions in a box plot format, showing the mean values (black squares), the median values (lines in the box) and the 10% (lower horizontal line), 25% (bottom of box), 75% (top of box) and 90% (upper horizontal line) percentile split in setup variability, prostate position variability and total error.
