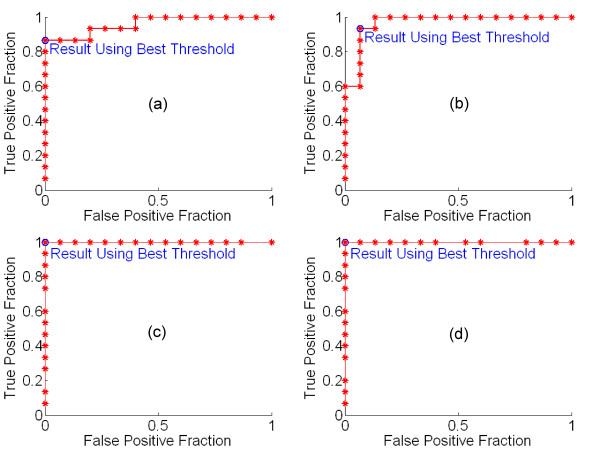
Figure 3.
ROC curves from the four healthy subjects using real movement. For each subject, the curve shown was obtained from the threshold-setting task prior to the subject's first game. (a) Subject A. (b) Subject B. (c) Subject C. (d) Subject D. All curves demonstrate very good classification; for Subjects C and D classification is perfect.

