Figure 3.
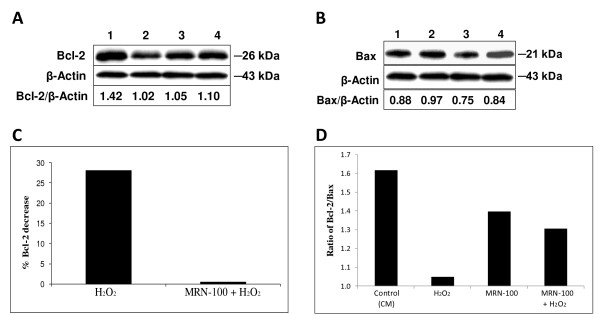
Effect of MRN-100 on Bcl-2 and Bax protein levels. Splenic cells were cultured in the presence of H2O2, MRN-100, MRN-100 + H2O2, or control (CM). Cell lysates were subjected to Western blot using anti-Bcl-2 or anti-Bax antibodies. Fig. 3A and 3B are representative blots showing Bcl-2 and Bax protein levels, respectively. Lane 1: Control (CM); Lane 2: Splenic cells exposed to H2O2; Lane 3: Splenic cells treated with MRN-100; Lane 4: Splenic cells pre-treated with MRN-100 and exposed to H2O2. Depicted below the blots is the ratio of Bcl-2/β-Actin (Fig. 3A) or Bax/β-Actin (Fig. 3B), respectively, as calculated using densitometry. Fig. 3C depicts the percent Bcl-2 decrease (calculated using densitometry) as compared to the respective control: H2O2 was compared to control (CM), and MRN-100 + H2O2 was compared to MRN-100 control. The value for H2O2 treatment was calculated by dividing the value of Lane 2 over the Lane 1 from Fig. 3A. The value for MRN-100 + H2O2 treatment was calculated by dividing the value of Lane 4 over Lane 3 from Fig. 3A. *highly significant (p < 0.001). Fig. 3D shows the Bcl-2/Bax ratio for each treatment. The Bcl-2 bands were measured using densitometry and were compared to Bax bands (data not shown). The ratio of Bcl-2/Bax is taken from a representative experiment.

