
Figure 3.
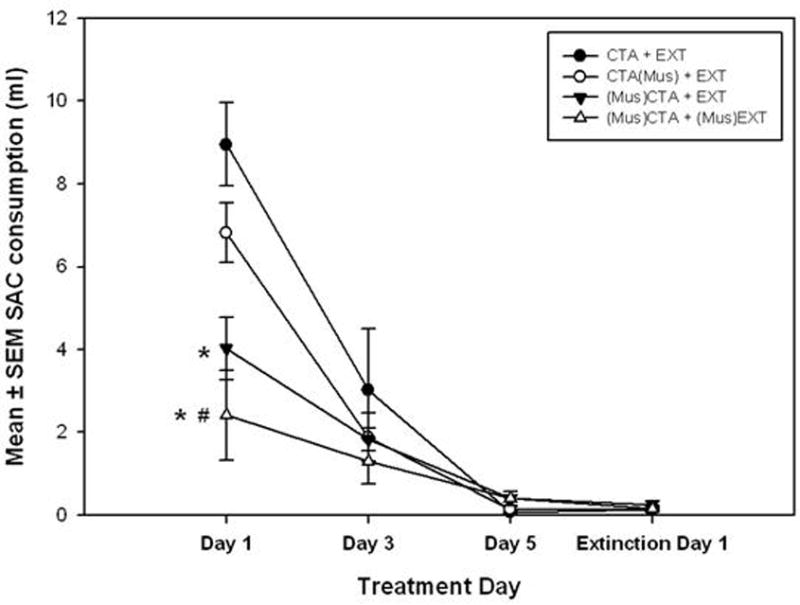
Experiment 2 SAC consumption data illustrating the development of a CTA over the three CS exposure days of conditioning and the first day of extinction. All treatment groups acquired a CTA. See Table 2 for group nomenclature. * = (Mus)CTA+EXT and (Mus)CTA+(Mus)EXT groups are significantly less than the CTA+EXT. # = (Mus)CTA+(Mus)EXT group is significantly less than the CTA(Mus)+EXT group. The CTA+EXT and CTA(Mus)+EXT groups appear to be significantly different on the first conditioning day due to the lack of overlapping error bars, but the difference is not statistically significant (F[3, 15] = 9.336, p=0.446). α = 0.05. Variance indicators are SEM.