Figure 1.
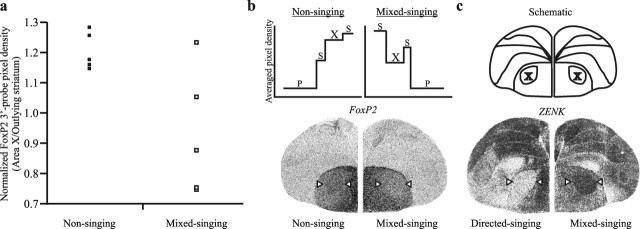
Area X FoxP2 levels vary between mixed singers. a, FoxP2 levels in area X are similar to those of surrounding StM in nonsingers but appear downregulated in many mixed singers. The variability between mixed singers exceeds that between nonsingers (p < 0.05). b, Top, Average pixel density obtained from line scans through representative images of hemicoronal brain sections (bottom) depict FoxP2 levels measured at the widest mediolateral extent. FoxP2 levels in area X of the mixed singer that sang the fewest motifs (88 motifs; right) appear lower than those in the nonsinger (left). c, High ZENK expression in area X of mixed singers (right; same bird as in b, right) indicates that, although housed with females, males sang some undirected songs. Left image from a 100% directed singer is shown for comparison. Schematic above indicates neuroanatomical landmarks. Arrowheads indicate area X. P, Pallium; S, striatum; X, area X.

