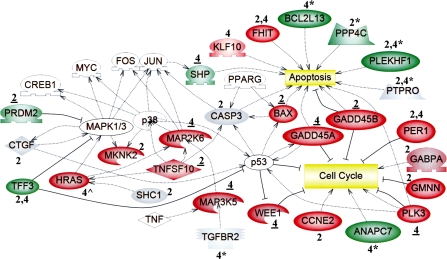
FIG. 2.
The expression and/or methylation statuses of genes involved in the cell cycle, apoptosis, and MAPK signaling were altered by PB at 2 and 4 weeks. Microarray analysis was used to identify uniquely active genes in livers of tumor-susceptible B6C3F1 mice at 2 and/or 4 weeks, as described in the Methods. Functional annotation of 367 uniquely active genes (Fig. 1; Supplementary Tables S3G–I) was performed. Expression is denoted as upregulated (red) or downregulated (green). Regarding qRT-PCR analysis, a change was confirmed if the time point is underlined (data in Supplementary Tables S4–S5); gray indicates either “not confirmed” (genes identified by microarray analysis) or “no expression change” (genes identified from regions of altered DNA methylation, RAMs). Genes noted as red or green that lack both underlining and symbols were not selected for confirmation. Genes identified from unique PB-induced RAMs in the B6C3F1 mice at 2 and/or 4 weeks (Phillips and Goodman, 2008) are denoted by asterisks (*), and their expression was evaluated at the time point directly preceding the asterisk (Supplementary Table S9). Ha-ras (∧) was hypomethylated and upregulated uniquely in B6C3F1 mice at 4 weeks (Bachman et al., 2006). White symbols represent “bridging” genes that were not altered in response to PB. Positive ( ) or negative (
 ) regulation is illustrated, and the shapes of the entities represent the specific class of molecules to which the gene belongs: extracellular proteins (
 ), ligands (
 ), kinases (
 ), transcription factors (
 ), phosphatases (
 ), and membrane receptors (
 ).
).

