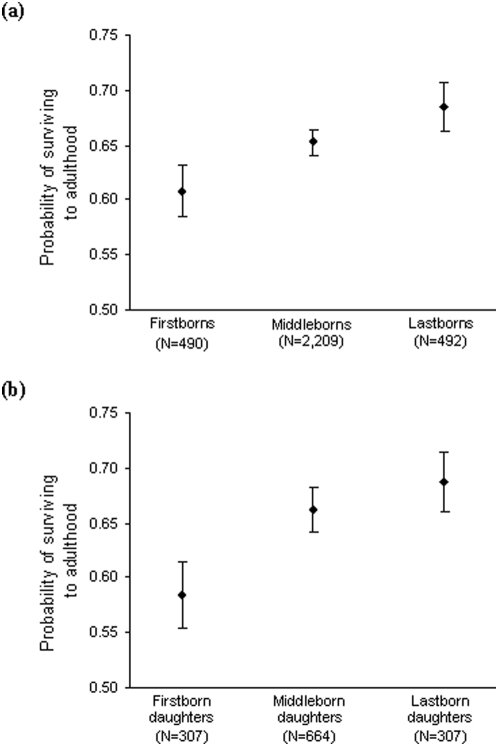
Figure 2. Probability of surviving to adulthood (age 15).
(a) As a function of overall birth-order category: the probability of surviving to adulthood was marginally significantly influenced by whether an individual was a firstborn, middleborn or lastborn among all offspring (χ2 2 = 5.76, p = 0.056). (b) As a function of intra-sex birth-order category (among daughters): the probability of surviving to adulthood was significantly influenced by whether a daughter was a firstborn, middleborn or lastborn (χ2 2 = 6.48, p = 0.04). Figures show predicted values of the minimal model and error bars represent standard errors of the means.

