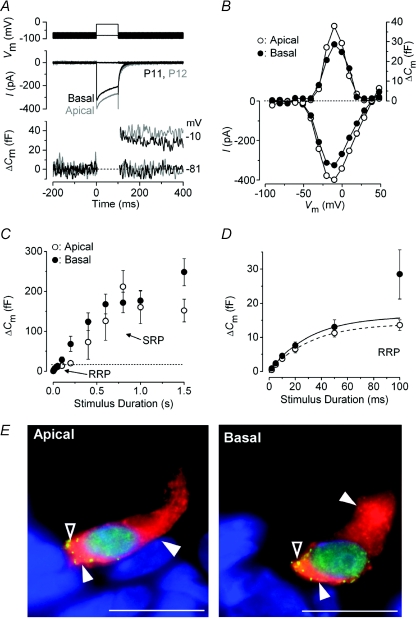
Figure 1. Neurotransmitter release in immature IHCs.
A, ICa (middle panel) and ΔCm (bottom panel) responses recorded from apical (grey traces) and basal (black traces) IHCs of the gerbil cochlea at around the onset of hearing. Recordings were obtained in response to 100 ms voltage steps from the holding potential of −81 mV to near −10 mV. The voltage protocol is shown in the top panel. B, current–voltage (I–V, bottom panel) and capacitance–voltage (ΔCm–V, top panel) curves from the IHCs shown in A. Recordings were obtained in response to 10 mV depolarizing voltage steps (100 ms) from −81 mV. C, average ΔCm responses from six apical (P5–P6) and ten basal (P6–P7) IHCs. Recordings were obtained by applying voltage steps from 2 ms to 1.5 s (to around −11 mV) in order to elicit both the RRP and SRP. D, expanded version of the first 100 ms shown in C where data up to 50 ms have been approximated with single exponential functions (apical: maximum ΔCm= 14.1 ± 2.7 fF, τ= 30.7 ± 12.5 ms; basal: maximum ΔCm= 16.3 ± 4.2 fF, τ= 30.9 ± 17.2 ms). The RRP consisted of 400 ± 45 (apical: n= 6, P5–P6) and 510 ± 96 (basal: n= 10, P6–P7) synaptic vesicles using a conversion factor of 37 aF per vesicle (Lenzi et al. 1999). Unless otherwise stated, in this and the following figures recordings were obtained at body temperature and using physiological 1.3 mm extracellular Ca2+. E, immunolocalization of synaptic ribbons (CtBP2: green dot-like pattern indicated by open arrowheads) and otoferlin (red: filled arrowheads) in apical and basal P4 IHCs. Nuclei were stained with DAPI (blue). Scale bars represent: 10 μm.

