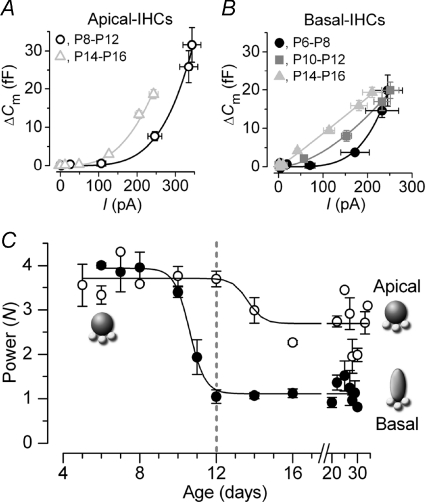
Figure 4. Changes in Ca2+ dependence of exocytosis in gerbil IHCs.
A and B, examples of synaptic transfer functions obtained by plotting average ΔCm against the corresponding ICa from I–V and ΔCm–V curves (as in Fig. 1B: voltage range –71 mV to −11 mV) of apical and basal IHCs, respectively. Data were grouped into age ranges at around the onset of hearing at P12. Fits are according to eqn (1). Values of N were: apical 4.3 (P8–P12, n= 12) and 3.0 (P14–P16, n= 10); basal 4.2 (P6–P8, n= 4), 1.7 (P10–P12, n= 12) and 1.1 (P14–P16, n= 10). C, developmental changes in N from both apical and basal IHCs as a function of days. Data points were obtained by averaging N values from fits to synaptic transfer functions of single cells using eqn (1). Note that basal IHCs start to mature a few days earlier than apical IHCs. The fits to the averaged data points are according to eqn (2). Numbers of cells: apical (P5–P34): 2, 7, 1, 1, 4, 4, 5, 5, 2, 1, 2, 3, 5, 2, 1; basal (P6–P30): 3, 6, 3, 4, 4, 4, 5, 5, 2, 2, 3, 2, 2, 2, 1.

