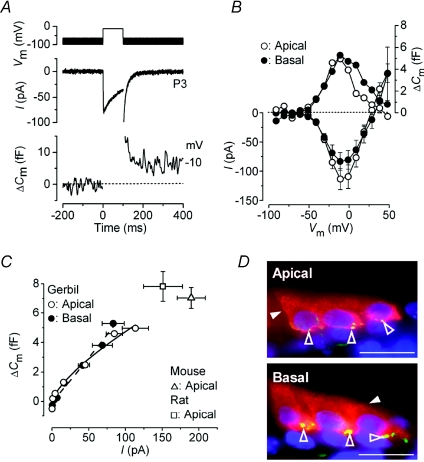
Figure 6. Neurotransmitter release in immature gerbil OHCs.
A, ICa and ΔCm responses recorded from an apical P3 gerbil OHC. Voltage protocol as described in Fig. 1A but using 5 mm extracellular Ca2+. Traces are the average of three protocol repetitions. B, average peak I–V and ΔCm–V curves from apical and basal OHCs (P3, n= 4 for each) using depolarizing voltage steps in 10 mV increments from −81 mV. The ΔCm values do not have s.e.m. since they were directly measured from the averaged traces of pooled cells. C, synaptic transfer functions for apical and basal OHCs. Average ΔCm was plotted against the corresponding ICa, between −71 mV and near −10 mV, from the I–V and ΔCm–V curves shown in B. Fits to the data points are according to eqn (1). The open triangle and square indicate the peak responses obtained from C57B mouse (n= 6) and rat (n= 6) apical OHCs, respectively. D, immunolocalization of active zones (green: open arrowheads) and otoferlin (red: closed arrowheads) in apical and basal gerbil OHCs (P4). The number of active zones in OHCs was: 1st row 8.9 ± 1.1 (n= 8), 2nd row 8.6 ± 1.4 (n= 8), 3rd row 9.0 ± 1.3 (n= 5); in basal OHCs was: 1st row 9.3 ± 1.0 (n= 8), 2nd row 10.9 ± 0.7 (n= 9), 3rd row 11.0 ± 0.7 (n= 8).

