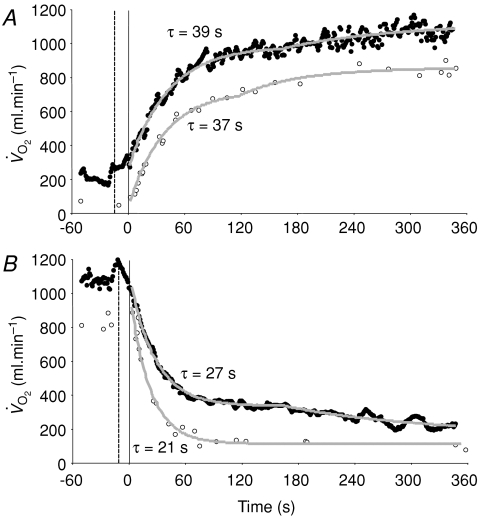
Figure 9. Muscle (○) and pulmonary (•) oxygen uptake responses to HI exercise (A) and subsequent recovery (B), with corresponding model fits and time constant values shown.
The pulmonary data have been ‘time-aligned’ to the muscle data by moving the data back by a time equal to the time delay preceding the phase II decrease in pulmonary oxygen uptake (dashed vertical line).

