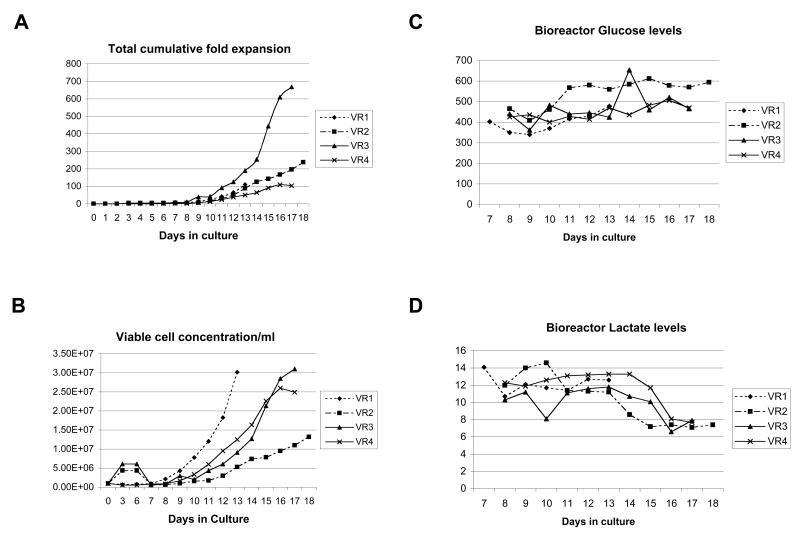
FIGURE 2.
T cell expansion, T cell concentration, glucose and lactate levels in the Wave Bioreactor during the course of VR1, VR2, VR3 and VR4. A, Total cumulative fold expansion of patient T cells. Data is shown from initial activation until completion of the expansion runs. B, Viable cell concentrations of patient T cells during activation and within the WAVE bioreactor. C, Glucose and D, Lactate levels were measured daily during the course of the validation runs.

