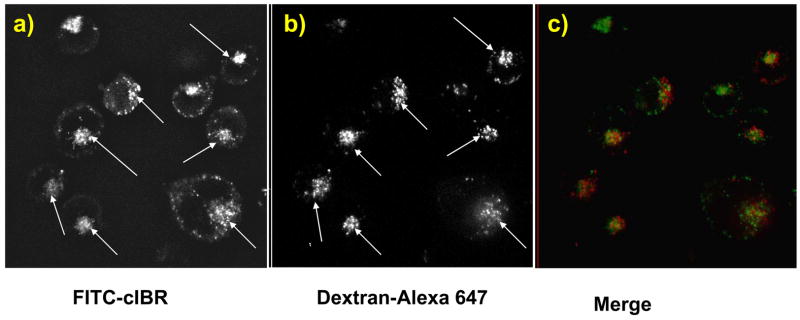
Figure 6.
Intracellular distribution study of FITC-cIBR and Alexa 647-labeled dextran molecules after incubation for 1 h with HL-60 cells evaluated using a confocal microscope. Panel a) shows the intracellular distribution for FITC-cIBR. Panel b) shows the localization of the Alexa 647-labeled dextran under the same conditions. Panel c) is a merger of panels a) and b).

