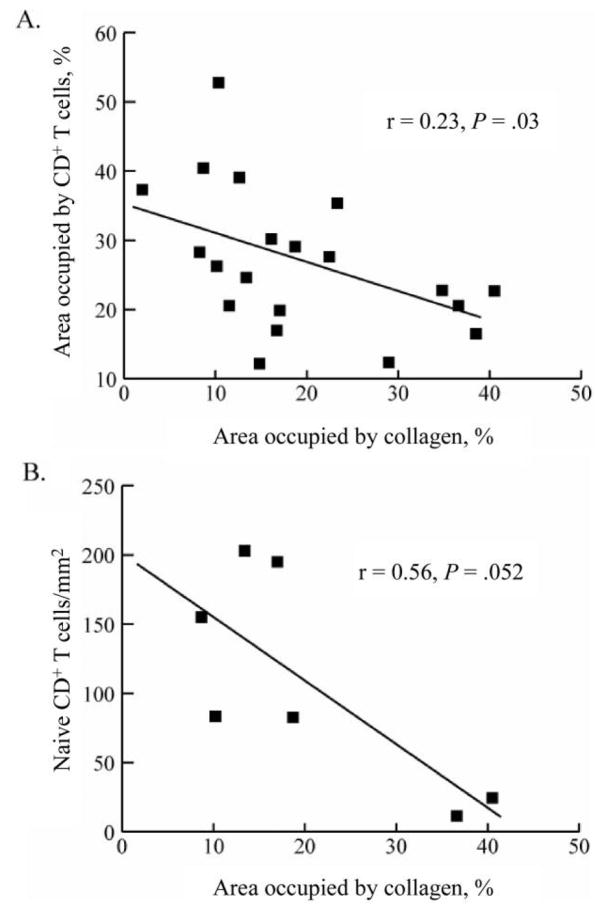
Figure 7.
Comparison of the size of the overall (A) and naive (B) CD4+ T cell population and the amount of collagen in the T cell zone of Peyer patches. There was a significant and inverse relationship between the size of the overall CD4+ cell population in Peyer patches and the amount of collagen in the same tissue, and this relationship also held when we compared collagen deposition and naive CD4+ cell population in Peyer patches.

