Figure 3.
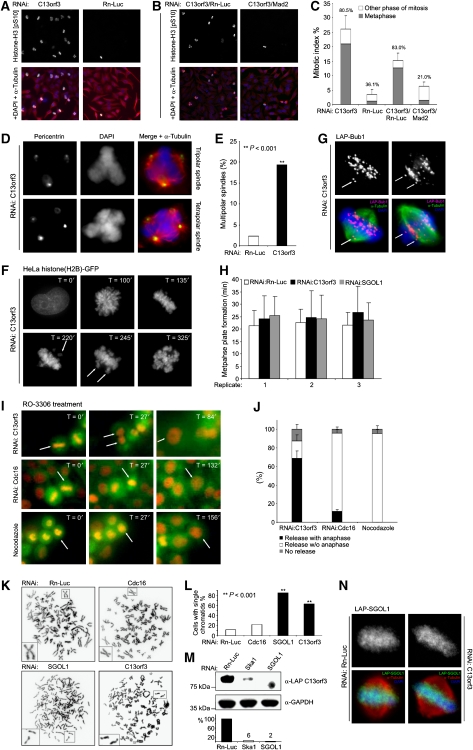
RNAi phenotypes upon C13orf3 depletion. (A) C13orf3-depleted cells arrest in metaphase. Anti-phospho-histone H3 (pS10) (green), DAPI (blue), and α-tubulin (red) stains are shown of HeLa cells treated with esiRNAs as indicated. Representative images of three independent experiments are shown. (B) Metaphase arrest upon C13orf3 depletion is dependent on spindle-assembly checkpoint integrity. Anti-phospho-histone H3 (pS10) (green), DAPI (blue), and α-tubulin (red) stains of HeLa cells treated with indicated mixtures of esiRNAs are shown. (C) C13orf3 depletion results in a SAC-dependent metaphase arrest with high statistical significance (P<0.001). Quantitative evaluation of phospho-histone H3 (pS10) stains (as in panels A and B) are shown. The mitotic index is shown with the percentages of cells arrested in metaphase indicated above the bars. At least 200 cells were counted for each experiment. Error bars indicate the standard deviation of three independent experiments. Significance tests were carried out with differences calculated between mitotic and metaphase indices of cells treated with C13orf3 or C13orf3/Mad2 esiRNAs versus controls by a two-tailed t-test. (D) Cells arrested by C13orf3 depletion show an increased frequency of multipolar spindles compared with control cells. Representative cells stained with antibodies against α-tubulin (red), pericentrin (green), and DAPI (blue) are shown. (E) Depletion of C13orf3 increases the number of multipolar spindles with high statistical significance (P<0.001). Quantitative evaluations of pericentrin stains (as in panel D) are shown. At least 80 metaphases were evaluated for each value. Significance tests were carried out with differences calculated between percentages of multipolar spindles of cells treated with C13orf3- versus Rn-Luc esiRNAs by a Pearson's χ2 test with Yates' correction for continuity (**). (F) C13orf3 is necessary for metaphase plate maintenance. HeLa cells stably expressing histone(H2B)-GFP depleted of C13orf3 followed by fluorescence time-lapse microscopy for the indicated time periods are shown. Arrows indicate unaligned chromosomes. Representative images from a total of 45 cells filmed by time-lapse microscopy are presented. (G) Immunofluorescence staining of LAP-Bub1 in mitotic HeLa cells after depletion of C13orf3 by RNAi. The single arrow (left panel) points to detached paired sister kinetochores, and the two arrows (right panel) point to separated sister kinetochores. Representative images are depicted from a total of 56 mitotic cells evaluated from two independent experiments. (H) C13orf3 depletion leaves the timing of metaphase plate formation unaltered. Measurement of the time from nuclear envelope breakdown to metaphase plate formation is shown. For every RNAi treatment, the average time and standard deviation of 15 cells are shown. The experiment was repeated three times independently. Average and standard deviations are given for every replicate separately. (I) Cdk1 inhibition promotes anaphase entry in arrested cells after C13orf3 depletion. HeLa cells stably expressing Cherry-histone(H2B) and GFP-tubulin arrested by RNAi against C13orf3, Cdc16, or nocodazole are shown (T=0). Selected frames from time-lapse microscopy after the addition of the Cdk1 inhibitor, RO-3306, are presented (T=27–156). Arrows track cells exiting from mitosis. (J) Statistical quantification shows significant differences in mitotic exit upon C13orf3-RNAi, Cdc16-RNAi, or nocodazole treatments. Cells arrested in mitosis after indicated treatments were analysed with respect to mitotic release by RO-3306 with progression to anaphase (black) or without anaphase (white). Arrested cells that could not be released by RO-3306 are shown in grey. Error bars indicate standard deviation for 200 evaluated cells from three independent experiments. (K) Sister chromatids are separated after mitotic arrest by C13orf3 or SGOL1 depletion. Representative chromosome preparations for HeLa cells treated with indicated esiRNAs are shown. Cells treated with the negative control Rn-Luc were arrested by nocodazole treatment before harvesting. RNAi against the APC/C component, Cdc16, was used as control for metaphase-arrested cells with X-shaped chromosomes. Individual chromosomes are shown as blow-ups. (L) Quantitative evaluation of metaphase spreads shows significant increase in single chromatids upon treatment with esiRNA for SGOL1 and C13orf3 compared with Cdc16 or Rn-Luc RNAi (P<0.001). For each treatment, 40–60 metaphases from two independent experiments were evaluated. Significance tests were carried out with differences calculated between the percentage of cells showing single chromatids treated with C13orf3, Cdc16, or SGOL1 and Rn-Luc esiRNA by a Pearson's χ2 test with Yates' correction for continuity (**). (M) C13orf3 protein stability is dependent on Ska1 and SGOL1. Western blot analysis of extracts from mitotic cells transfected with indicated esiRNAs and stained with indicated antibodies are shown. Size standards are depicted on the left. Quantifications of the band intensities by densitometry are shown below the western blot. Numbers indicate the protein levels in percent after RNAi treatment, normalised to GAPDH. The intensity for the mock control (i.e., Rn-Luc esiRNA) was used as reference. (N) SGOL1 protein stability and localisation is not dependent on C13orf3. Immunofluorescence stains of LAP-SGOL1 in mitotic HeLa cells after treatment with esiRNAs against C13orf3 or Rn-Luc are shown. Representative images are depicted from a total of 48 mitotic cells evaluated from two independent experiments.

