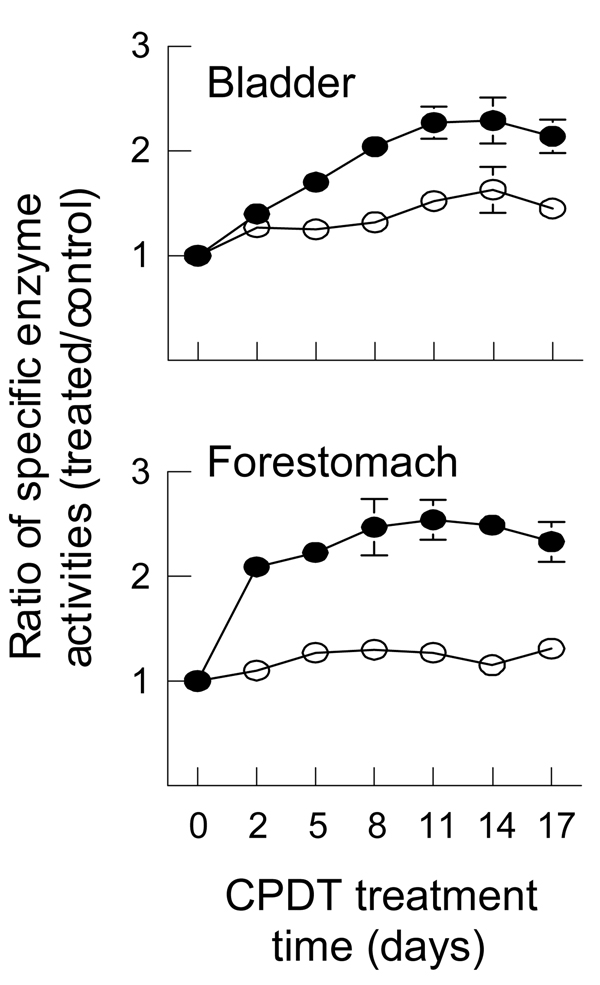
Fig. 2.
Time course of induction of GST and NQO1 by CPDT in bladder and forestomach in vivo. Groups of 6 rats were dosed with CPDT at 3.91 µmol/kg/day by gavage once daily for 2, 5, 8, 11, 14 or 17 days. Another group of 12 rats was dosed with vehicle. The animals were killed the day following the the last dose and both bladder and forestomach were harvested for analysis of GST and NQO1. Each value (mean ± SEM) is the ratio of specific activities (treated/control) of GST (□) and NQO1 (■). The specific enzyme activities of GST and NQO1 in the control tissues are provided in Fig. 1. All increases in enzyme activity were significant (P<0.05) except for the GST values at 2 and 14 days in the forestomach.

