Fig. 3.
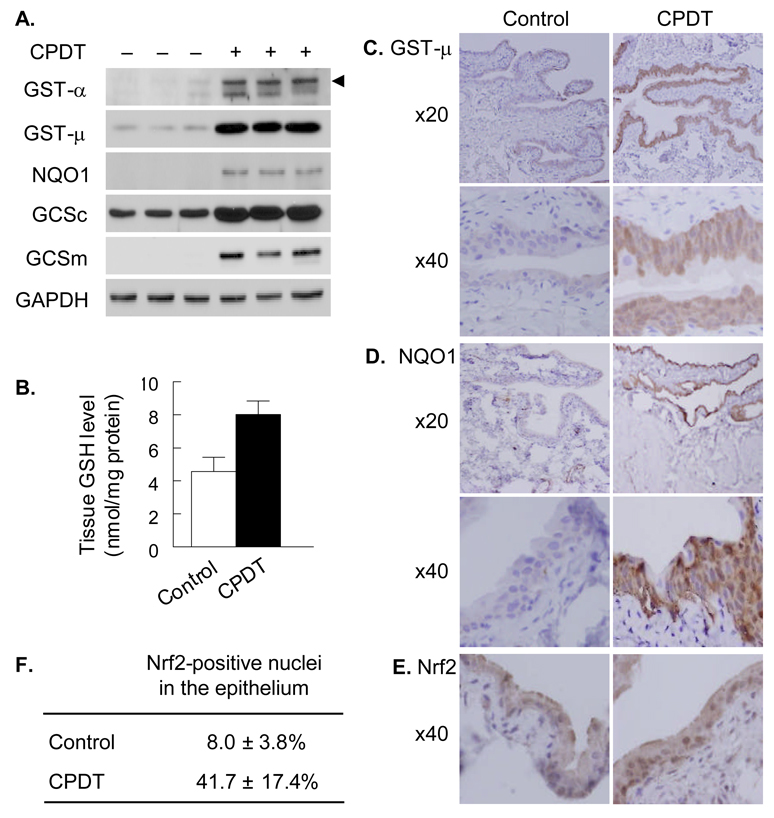
The inductive effect of CPDT on Nrf2 and Phase 2 genes in the bladder in vivo. Groups of 5 rats were dosed with either vehicle or CPDT at 125 µmol/kg/day for 5 days. The animals were killed one day after the last dose to harvest bladders for analyses. A. Western blot analysis of various Phase 2 proteins in bladder specimens (whole tissue homogenates), showing results from 3 control rats and three CPDT treated rats; GAPDH was used as a loading control. The arrow head points to the GST-α band; the lower band might be caused by non-specific antibody binding. B. Tissue GSH levels; each value is a mean ± SD. The two values are significantly different (P<0.05). C and D. Representative images of immunohistochemical staining of GST-µ and NQO1 in bladder tissues, showing both low (×20) and high (×40) magnifications. E and F. Representative images of immunohistochemical staining of Nrf2 in bladder epithelium and percentage of Nrf2-positive nuclei. Each value is mean ± SD; a total of 250 nuclei in 5 fields were counted in slides from each bladder.

