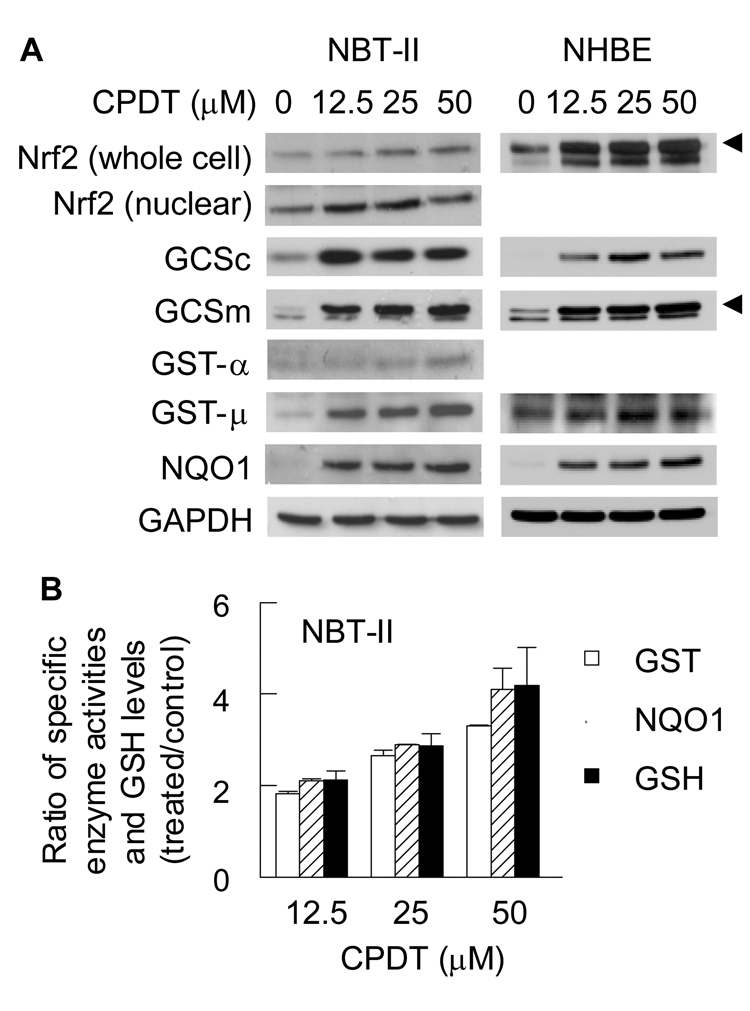
Fig. 4.
Activation of Nrf2 and induction of Phase 2 enzymes by CPDT in cultured bladder cells. Cells were treated with CPDT at the indicated concentrations for 48 h and then harvested for analysis. A. Nrf2 and various Phase 2 enzymes were measured with Western blot analysis. Whole cell extracts were used, except for Nrf2 which were measured in both whole cell extracts and nuclear extracts. GAPDH was used as a loading control. The data are representative of at least two experiments. The specific bands in some blots are indicated with an arrow head; the unidentified band in these blots might result from non-specific antibody binding. B. Measurement of enzyme activities of GST and NQO1 and measurement of GSH levels in whole cell extracts. Each value is a mean ± SD (n=3). All values are significantly different from their controls (<0.05). The values in the control cells were as follows: 34.67 ± 4.49 nmol/mg protein (GSH), 92.64 ± 2.03 nmol/min/mg protein (GST) and 1.35 ± 0.01 µmol/min/mg protein (NQO1).

