Abstract
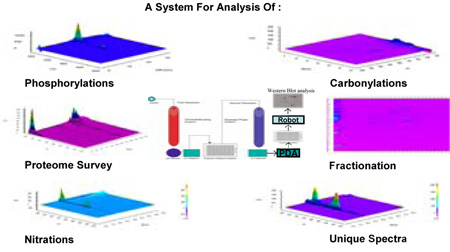
Post-translational protein modifications have contributed significantly to the identification of macromolecular biomarkers of biological processes. We have modified a 2-dimensional HPLC system (Beckman Coulter PF2D ProteomeLab) to create proteome maps of post-translational protein modifications. This system resolves complex protein mixtures by anion exchange chromatofocusing in the first dimension and hydrophobicity (reverse phase chromatography) in the second dimension. The simultaneous identification of multiple protein modifications, accomplished by incorporating a photo diode array (PDA) detector into the PF2D system, facilitates the simultaneous production of three dimensional proteome maps and visualization of both unmodified and post-translationally modified (PTM) proteins at their signature wavelengths within the proteome. We describe procedures for the simultaneous resolution of proteome maps, the identification of proteins modified by nitration, carbonylation, and phosphorylation, and proteins with unique spectra such as the heme containing proteins.
Keywords: post translation modification, nitration, phosphorylation, carbonylation
Introduction
Recent advances in identification of multiple post-translational modifications have proven to be important markers of normal and pathological biological processes (1). This rapid increase of biomarker identification encompasses such pathological circumstances as cancer (2), cardiovascular disease (3), brain injury (4), trauma (5) and population proteomics (6) as well as normal biological processes of development (7). The ability to apply high throughput proteomics technologies to the simultaneous and global detection of post-translationally modified proteins or changes in protein pool levels augments the development of biomarker proteome maps for specific biological processes.
Standard methods of visualization of proteome maps involving the classical two dimensional gel electrophoresis (2-DE) coupled to immunoblotting analysis and mass spectrometry are commonly used for biomarker identification within proteome maps of specific tissues, e.g., cardiac tissue (8), liver (9) and organelles (10–12). However, this procedure has disadvantages such as limited detection of proteins with extreme hydrophobicity, mass or isoelectric point, as well as sample recovery and reproducibility of patterns (13, 14). Through the use of the PF2D system we have overcome many of these problems. Unlike 2-DE, the PF2D system is highly reproducible and provides such advantages as the ability to archive the fractions for later analysis and analyze fractions by direct application to various mass spectrometry technologies and/or western blotting. Furthermore, the collection times can be altered or fractions can be re-injected for expanded resolution of protein mixtures.
The uniqueness of our system is its ability to simultaneously develop multiple proteome-maps of specific biomarkers thus providing basic information on the character of biological processes associated with normal and pathological conditions. With the rapid development of protein modification chemistry our system facilitates the detection of many known PTMs involved in these biological processes and allows us to analyze the mechanisms for the production of such PTMs.
Materials and Methods
Modification of the PF2D Fractionation System
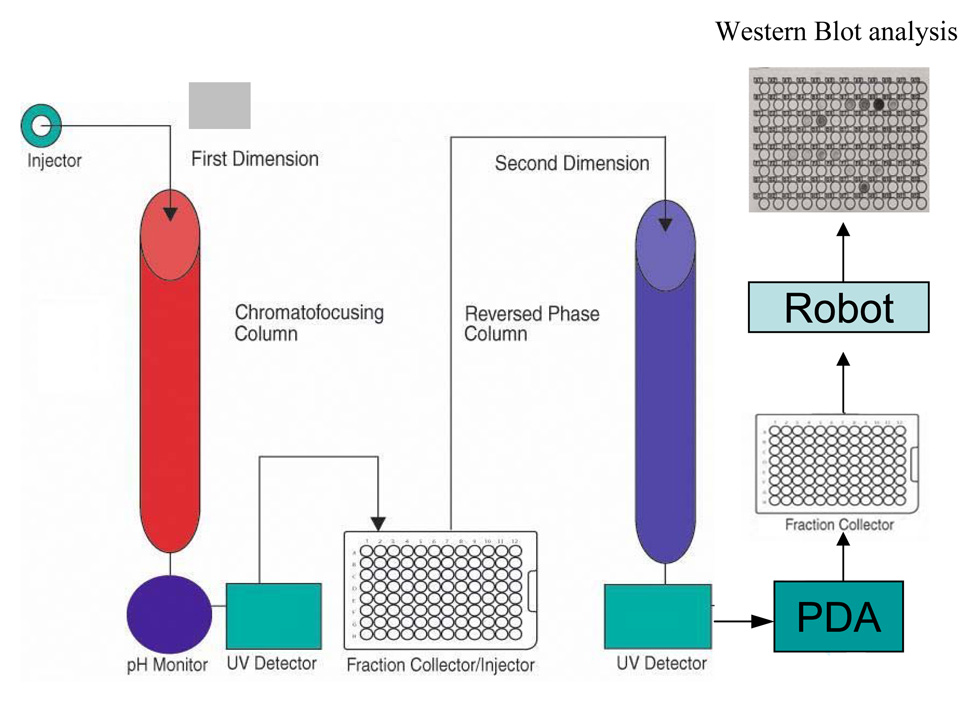
To facilitate the construction of multiple proteome maps, we modified the PF2D by incorporating a photo diode (PDA) array (Beckman Coulter 168 Photo Diode Array) into the system to compliment the tunable single wavelength detectors used for the generation of the 1st and 2nd dimensional fractionation tracings (Fig. 1). The PDA has an additional two tunable single wavelength channels and a capability that scans absorbance from 190–600 nm/sec. Thus, we have a system with a tunable channel in the 1st dimension and three tunable channels and a scanner in the 2nd dimension. Together these generate 3D and contour proteome maps using the 32 Karat software (Beckman Coulter) and monitors up to three wave lengths for unmodified and modified proteins. Incorporation of the PDA has facilitated the detection of PTMs that are either derivitizations of a particular adduct that generates a unique absorbance (e.g., the diphenylhydrazine derivitization of carbonyls that generates a diphenylhydrazone adduct having an absorbance at ~350 nm (acidic) and derivatized phosphoproteins i.e. using Pro-Q Diamond LC Phospho Peptide Detection Kit (Invitrogen) at 550–580 nm); or directly by detecting a PTM with distinctive absorbance (e.g., nitrated proteins at 360 nm). Fractions are collected in the first dimension from pH 8.5 – 4.0 at 0.3 pH intervals or 1 ml. These fractions are separated in the 2nd dimension by hydrophobicity (non-porous reverse phase) typically 18-one minute intervals from 6–23 minutes. UV data are collected from a 100% aqueous phase to a 100% organic phase over 35 minutes.
Figure 1. A schematic diagram of the modified protein fractionation system with PDA.
Proteins are injected into the 1st dimension chromatofocusing column, monitored by the UV detector at 280 nm, and collected into a 96 well plate at 0.3 pH or 1 ml intervals. These fractions are injected into the 2nd dimension reverse phase column by the fraction collector/injector for further separation, monitored by a second UV detector at 214 nm, and scanned by a PDA from 190–600 nm. The PDA also supports two single channel tunable wavelengths for PTM with unique wavelengths. The protein fractions are finally collected into an eight plate fraction collector for archive or for further analysis including robot printing of arrayed fractions for Western analysis.
Incorporating a photodiode array detector model 168 (Beckman Coulter) into a PF2D system
Plumbing
The 168 was plumbed following the 2nd dimension 166 detector by disconnecting the outlet line going to the Gilson fraction collector and connecting it to the inlet line of the 168. The outlet line from the 168 was then connected to the fraction collector.
Communication
A remote I/O cable is modified by removing one end and isolating two wires; the brown with white tracer, and the solid red wire. These correspond to pins 15 and 16 respectively. These two wires are connected to the remote interface unit of the PF2D at terminals 15 and 16. The modified cable in then plugged into the 168 detector.
Software
The 168 instrument is configured in the 32 karat software just as the PF2D instrument was. A method for the 168 detector is created with values complementing the 2nd dimension acquisition i.e. Time Program: Time = 35.0 min; Module = 168 Det; Function = Stop Data; Instrument Setup in the 168 Det tab the channels are set to the desired wavelengths and the scan definition is set i.e. 190–600 nm with a scan interval of two (every other second); Under the injection tab the trigger is set to external. This method is saved to a 168 detector methods folder. A standard method for the PF2D is modified in the Instrument Setup by inserting a line in the 2D Time Program: Time = 0.0 min; Module = HPRP module; Function = Relay On; Value = 4; Duration= 0.10. The method is then saved in the PF2D methods folder as a PF2D-168 method.
Running Samples
For a single sample a plate with sample is placed in the FC/I module. The 168 instrument is selected from the 32 Karat software and communication established as indicated by the direct control panel. The single run icon is selected from the task bar. Values for the Sample ID, Method, Data Path, and Data File are filled in. The method is the one created in the 168 methods folder. The method is then started. The method will be loaded and equilibrated terminating in a “waiting for trigger” message. The trigger will come from the line that was placed in the 2D Timed Program. The PF2D instrument is then selected from the 32 Karat software and communication established as indicated by the control panel. A single run is selected from the task bar. Values for the Sample ID, Method, Data Path, and Data File are filled in. The PF2D-168 method is selected as is the appropriate well location and injection volume. The PF2D method is then started. When the second dimension of the PF2D begins it sends a signal to relay 4 starting the data collection in the 168PDA. For multiple samples a sequence table is created for the 168 detector either reflecting the sequence table from the PF2D or a general table 50 or so entries that can be edited following the creation of the sequence table from the PF2D. It is highly recommended that “date and time” be selected as one of the values for the data file since data files can not have the same names.
Preparation of protein samples for PF2D fractionation
DNP-derivatized serum albumin
Carbonylation of commercially available serum albumin was carried out according to the method of Levine et al (15). The derivatized albumin was prepared in water before injecting into the 2nd dimension reverse phase columnm.
Nitrotyrosine modified proteins
Nitrated bovine serum albumin (BSA) was purchased from Cayman Chemicals, Ann Arbor, Mi (catalog No. 89542). Nitrated lysozyme was prepared by the method of Bian et al (16). Both BSA and lysozyme were prepared in start buffer before injecting them into the PF2D system.
Proteins with unique spectra
Cytochrome c was purchased from MP Biomedicals. Myoglobin was purchased from Sigma. Both cytochrome c and myoglobin were prepared in water before injecting into the 2nd dimension reverse phase column.
Phosphorylated proteins
To view phosphorylated proteins we employed a fluorescence based detection system ( Molecular Probes, Pro-Q® Diamond LC). The phosphopeptide detection system is specifically for HPLC separation and UV detection of phosphopeptides (excitation/emission maxima 555/580). The system is designed to detect phosphothreonine, phosphotyrosine, and phosphoserine containing peptides at slightly altered retention times. In addition to the detection of phosphopeptides we have employed the system for the detection of phosphoproteins, and to survey phosphoproteins in a proteome (liver) using an altered protocol. Briefly, proteins in PF2D start buffer were desalted using Zeba™ Desalt Spin Columns (Pierce) after adding 50% ethanol to 20% of the total volume. All reagents were 10 fold higher than protocol recommendations i.e. 25 µl of Pro-Q® Diamond detection reagent and 25 µl of 10× activation reagent was added to 200 µl sample from Zeba spin column for a total volume of 250µl. Membrane lysis buffer (50µl) was then added to resuspend ppt proteins. Desalted Pro-Q® labeled sample (100–200 µl) was then injected into the 2nd dimension of the PF 2D/ PDA system.
Isolation of liver proteins
Snap frozen liver samples were thawed and homogenized in membrane lysis buffer (5M urea, 2M thiourea, 10% glycerol, 50mM Tris-HCL (pH 8.0), 2% (w/v) n-octylglucoside, 0.5%(w/v) SB3-10, 1.0mM protease inhibitor (Sigma P2714). The suspension was then centrifuged to remove particulate material (15,000×g for 20 min.). The supernatant was then buffer exchanged with PF 2D Start Buffer (Beckman Coulter Part number: 391110) in a PD-10 desalting column (Amersham Pharmacia Biotech). The eluant was then subjected to bicinchoninic acid protein assay (BCA™ Protein Assay Kit, Thermo Scientific) analysis to determine the protein concentration.
Isolation of creatine kinase from muscle homogenates
Quadriceps muscles from aged C57/BL/6 mice were homogenized in a polytron blender in nondenaturing buffer (50mM sodium phosphate (pH5.8), 1mM DTT, 0.4mM EDTA and 1mM PMSF). Insoluble material was removed by centrifugation (8000 × g) for 30 minutes. The purification of mouse CK was based on a method described by Fisher and Whitt (17) with slight modifications. Fractionation of the muscle proteome was accomplished with a 5 ml blue sepharose affinity column (Amersham Biosciences, High Trap Blue HP) and a dual pump HPLC system (ESA Biosciences) equipped with a UV–Vis detector (Model 528, ESA BioSciences). Fractions enhanced for nitrated CK were obtained and confirmed by western analysis. One such fraction was collected for analysis with the PF2D/ PDA system.
Western Analysis of PF2D Fractions
Fractions from the first or second dimensions were blotted onto PVDF or charged nylon solid supports using a Schleicher & Schuell (S&S) 96 well dot blotting apparatus modified to attach to the deck of a Beckman Coulter Biomek 2000 robot (Fig. 1). PVDF membranes were pre-wetted in 100% methanol for 15 seconds then washed in transfer buffer (TB; 25 mM Tris base, 192 mM glycine, 0.05% SDS, 20% methanol). PVDF membranes were supported by two sheets of S&S GB002 gel blotting paper soaked in TB. A modified Schleicher & Schuell dot blotting apparatus was assembled on the deck of the robot with the membrane and support paper and washed with 200 µl of TB with 20 in/hg vacuum until all the wells cleared. TB (200 µl) was again added to the wells along with samples from 96 well plates obtained from the first or second dimensions. Vacuum was reapplied at 20 in/hg until the wells cleared. The wells were then washed a second time with 200 µl TB followed by vacuum and the membranes removed to transfer buffer for blocking or dried for extended storage (soak in 100% methanol then placed on blotting paper until dry) at −20°C. Sample volumes vary but typically 10 µl of first dimension sample and 100 µl of 2nd dimension sample were applied for Western analysis. Membranes were blocked with blocking solution containing 5% non-fat dry milk in TBS-T (50 mM Tris-HCl, pH 7.4, 20 mM NaCl, 0.05% v/v Tween-20) for 1 hour. Primary antibody diluted in blocking solution was added to the membranes for varying times according to recommendations by the manufacturer of the antibody. The membranes were washed 3 times for 5 min each in TBS-T. The HRP conjugated-secondary antibody diluted in blocking solution was added for 1 hour followed by washing in TBS-T for 15 min and twice additionally for 5 min each. Membranes were incubated by either Pierce SuperSignal West Pico chemiluminescent substrate or Millipore Western HRP substrate for 5 min and immunoreactive spots were visualized by exposing the membrane to Kodak X-OMAT film for appropriate times. If needed, membranes were stripped with Restore™ Western Blot Stripping Buffer (Pierce) for 5–15 minutes and reprobed with other antibodies as described above.
Results
Modification of the PF2D spectrophotometric detection system
To expand the capabilities to simultaneously develop multiple proteome-maps we modified the PF2D by adding a Photo Diode Array (PDA) to the system to compliment the tunable single wavelength of the PF2D detectors already incorporated into the first and second dimensions of the system. The PDA-168 (Beckman Coulter) has two tunable single wavelength channels and a scanning capability that includes absorbance from 190–600 nm (Fig. 1). The goal of this additional capability is to detect PTMs that result in new absorbance characteristics in addition to their signature absorbance at 214/280 nm.
Detection of carbonylated proteins
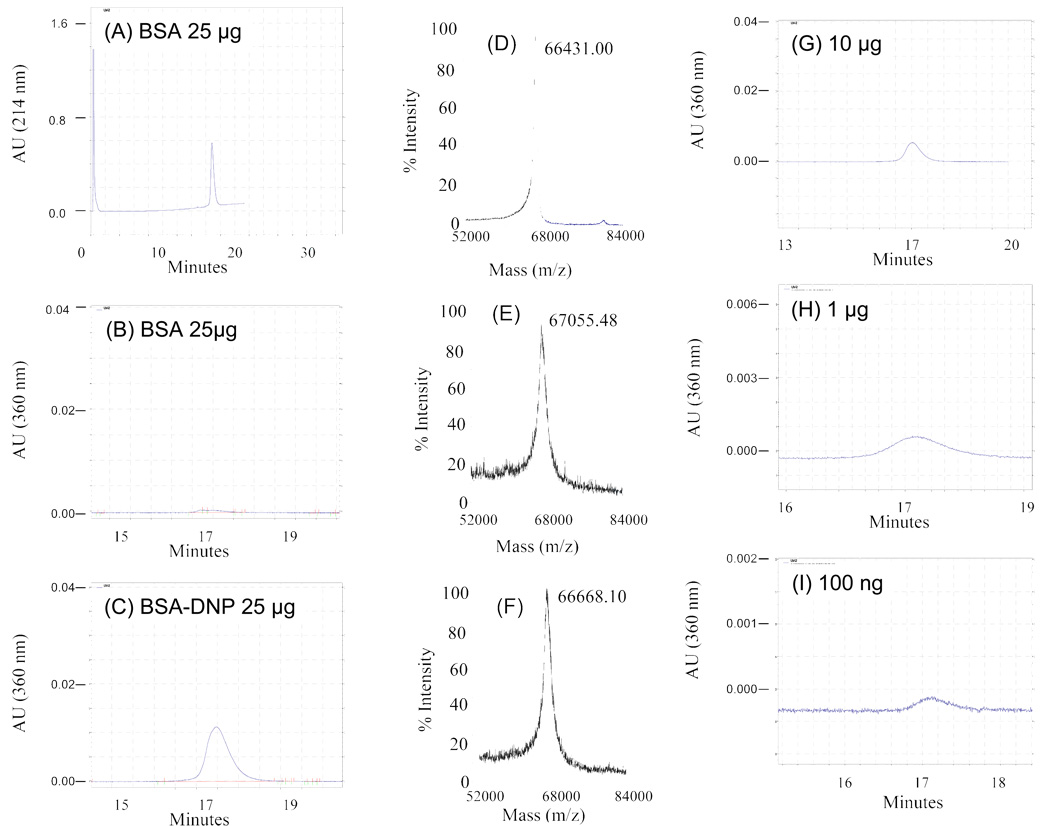
Carbonyl groups caused by oxidative modification produce a new absorbance at 360 nm when derivatized with dinitrophenyl hydrazine (DNPH) (Fig. 2A–2C). Thus, the new absorbance characteristics caused by such PTMs as the derivitization of oxidatively modified amino acid residues can be detected at a distinctive absorbance. The data in Figure 2 show a PF2D 2nd dimensional chromatogram which detects unmodified BSA at 214 nm (Fig. 2A) and at 360 nm (Fig. 2B, minimal absorbance is detected at 360 nm). On the other hand, the DNP-derivatized carbonylated protein is clearly detected at 360 nm (Figure 2C). These data suggest that by derivitization of cell extracts the patterns at 214 nm would produce a global proteome map of the total extract while the pattern at 360 nm would produce a global proteome map of the derivatized oxidatively damaged proteins. MALDI-TOF mass analyses of the BSA, BSA-DNP, and a BSA/BSA-DNP mixture are shown (Figure 2D–2F). A mass shift of 180 amu is predicted for every DNP moiety added to a protein. Our unmodified BSA has a mass of 66431 while the DNP derivatized BSA has a mass of +624 (67055) indicating that there may be 4 carbonyls that are derivatized with DNPH (Fig. 2E). A 50/50 mixture of the unmodified BSA and BSA-DNP shows a mass of +387 (66668.1) indicating about half of the derived modifications as predicted (Fig. 2D vs. 2F). Although the data indicate that there are ~4 carbonyls that are derivatized with DNPH the extra mass, not evenly divisible by 180 suggests that the protein molecules may not be fully oxidized in this in vitro reaction. In addition, the limit of detection of the derivatized BSA is indicated by the dilution series shown in Figure 2 (G–I) which ranges from10 µg to 100 ng.
Figure 2. A comparison of the reversed phase fractionation of DNPH-derivatized and non-derivatized BSA.
Elution patterns for non-derivatized albumin at (A) 214 nm and (B) 360 nm, and for DNPH-derivatized albumin at (C) 360 nm. MALDI-TOF analyses of the albumin fractions eluted from the reverse phase fractionation are of (D) unmodified albumin and, (E) DNPH-derivatizaed albumin. (F) Analysis of a 50:50 mixture of unmodified : DNPH-modified albumin. Limits of detection of the modified protein are shown in the dilution series (G–I)
Our experiments have demonstrated that carbonylated proteins can be detected by the PF2D after they are derivatized with 2,4-dinitrophenylhydrazone (DNP) by adjusting the absorbance of the tunable UV wavelength to 360 nm.
Detection of heme-containing proteins, cytochrome c and myoglobin
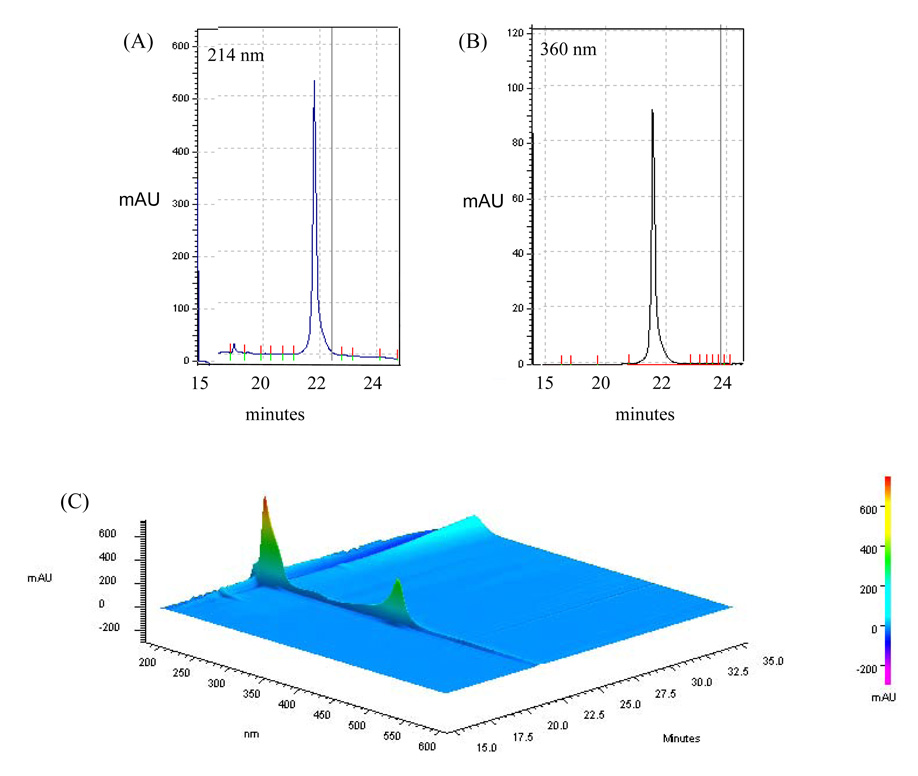
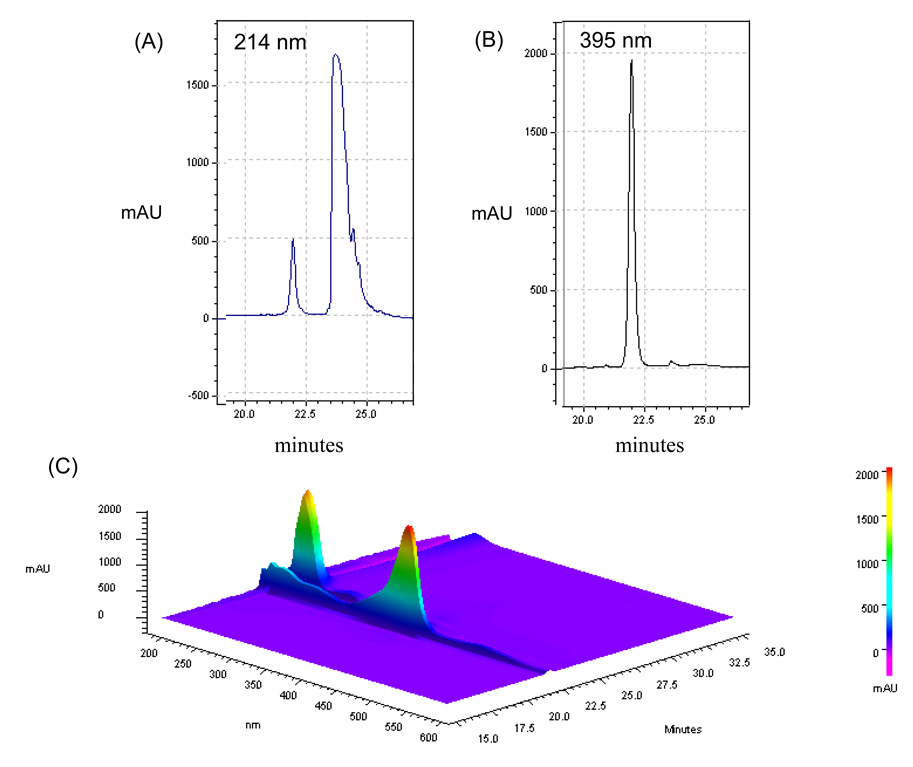
Simultaneous acquisition of signature wavelength scans and a 3D map of cytochrome c is shown in Figure 3. The data in Figure 3A–3B show the absorbance patterns of cytochrome c (4 µg) at 214 nm and 395 nm respectively; the 3D contour map in Figure 3C demonstrates the simultaneous detection of cytochrome c absorbance maxima at 214 nm and ~400 nm when scanned with the PDA. Similar maps demonstrate the elution pattern of myoglobin (40 µg) at 214 and 395 nm (Fig. 4A–4B) and a 3D absorbance pattern produced by scanning the fractions from 190–600 nm (Fig. 4C).
Figure 3. The PF2D-PDA signature of cytochrome c.
The use of PF2D-PDA fractionation-scanning for the simultaneous detection of cytochrome c at (A) 214 nm; (B) 360 nm. (C) A 3D contour map showing the simultaneous detection of cytochrome c at 214 nm and ~400 nm.
Figure 4. The PF2D-PDA signature of myoglobin.
The PF2D-PDA fractionation-scanning for the simultaneous detection of the heme-containing protein, myoglobin, at 214 nm (A) and 395 nm (B). (C) A contour 3D map showing the simultaneous detection of myoglobin at 214 nm and 395 nm.
Detection of metabolically modified proteins: tyrosine, serine, threonine phosphorylated proteins
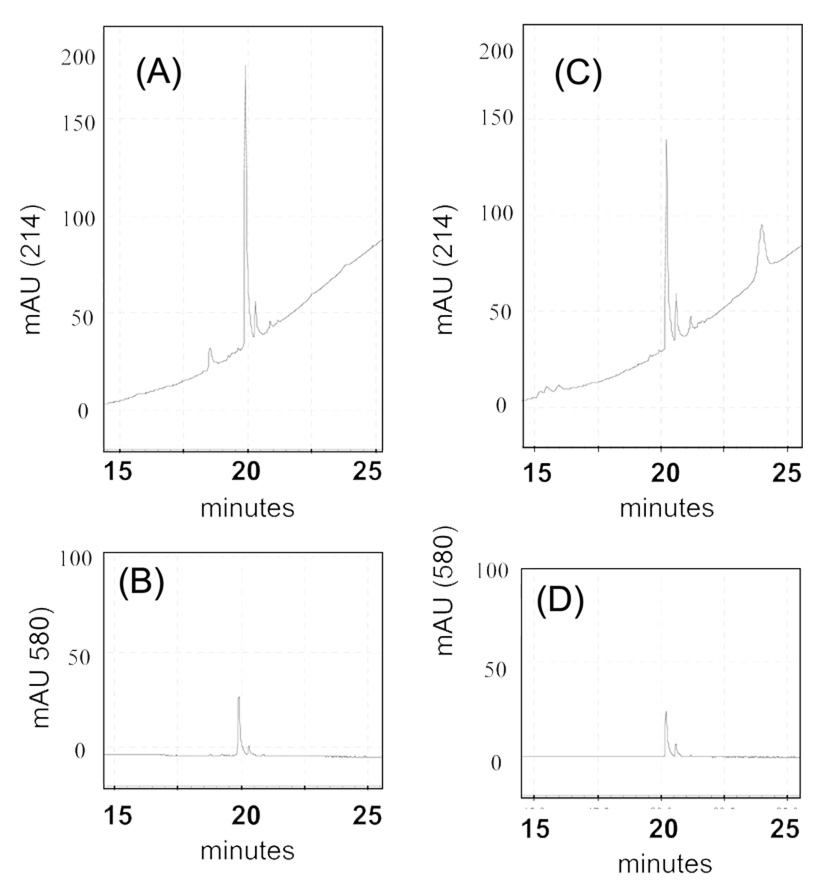
To view phosphorylated proteins we employed a fluorescence based system that is specific for the HPLC separation and UV detection of phosphopeptides due to their excitation/emission maxima at 555/580 (Molecular Probes, the Pro-Q® Diamond LC Phosphopeptide Detection). The system is designed to detect phosphotyrosine, phosphothreonine, and phosphoserine containing peptides based on their slightly altered retention times on the HPLC column. We employed this phosphopeptide detection kit to develop a phosphoprotein proteome-map using the PF2D-PDA system. The chromatograms of the standard phosphopeptide, RII, DLDVPIPGRFDRRVPSVAAE, provided by the manufacturer, showed the dual wavelength identification of this peptide when monitored by the PDA detector at 214 nm and 580 nm during the second dimensional fractionation (Figure 5A, 5B). We then tested whether the same procedure could detect an intact ProQ derivatized protein. Alpha-casein, a phosphorylated protein, when modified by ProQ treatment was found to be detectable under the same conditions as the RII control peptide (Figure 5C, 5D).
Figure 5. The PF2D-PDA detection of phosphorylated peptides and α casein.
A 2nd dimensional reverse phase chromatogram of the standard ProQ derivatized phosphopeptide, RII, showing the dual wavelength identification of this peptide when monitored by the PF2D-PDA detector at (A) 214 nm and (B) 580 nm. Detection of ProQ derivatized α-casein (0.5 µM) during 2nd dimensional reverse phase fractionation at (C) 214 nm and (D) 580 nm.
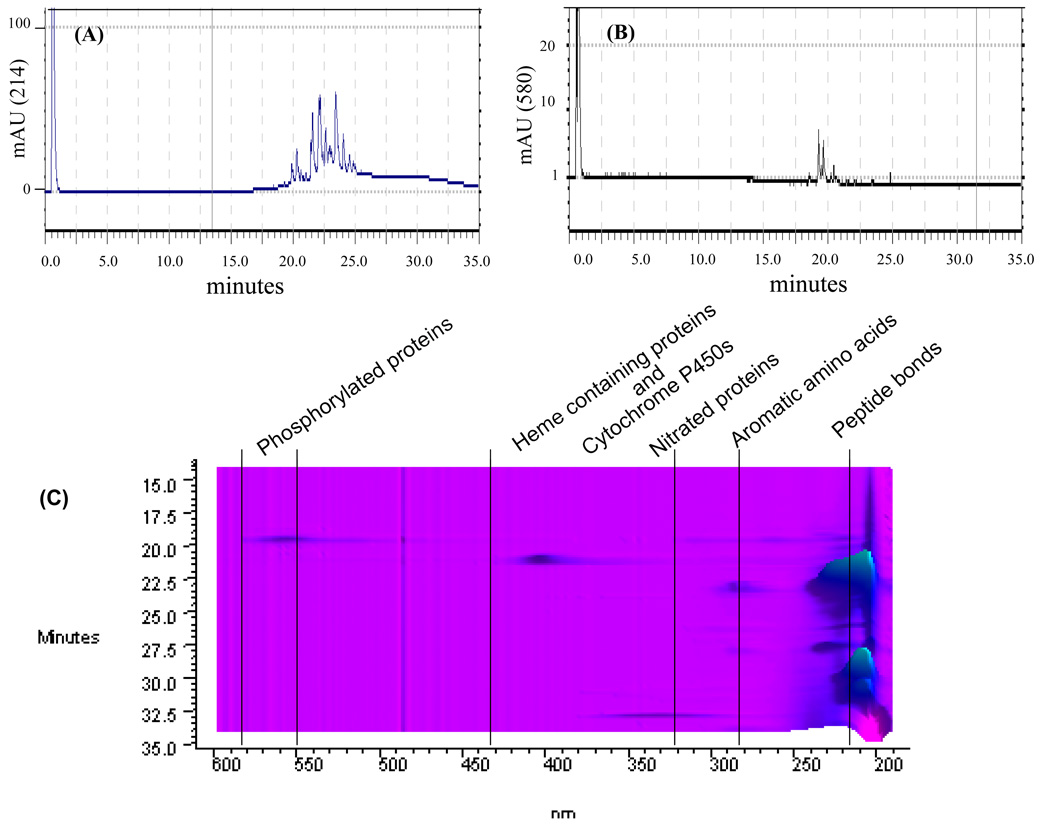
Application of the same procedure for the detection of phosphorylated protein within a proteome-map of a mouse liver tissue extract required certain modifications of the reaction procedure with ProQ. The ProQ phospho-detection reaction requires that the samples be free of salts and buffers. Application of the procedure to a mouse liver extract resulted in some sample precipitation. To address this problem the protocol was modified by adding the activation and detection reagents first, followed by the addition of membrane lysis buffer. Although this cleared the sample, the precipitation of proteins prior to their ProQ labeling may result in the loss of some proteins and/or the failure of some proteins to label properly. To address this we labeled 0.5 mg of mouse liver extract and subjected it to 2nd dimensional fraction. The data in Figure 6 show that the phosphorylated proteins within a ProQ treated tissue extract can be detected at 214/ 280 nm during fractionation of a total tissue extract (Figure 6A, 6C); the phosphoproteins corresponding to peaks detected at 214/280 nm were simultaneously detected at ~580 nm (Figure 6B, 6C). This multiple detection occurs simultaneously within a scan from 190–600 nm. Interestingly, the system also detects other modified proteins at ~360–430 nm. These signals can correspond to heme-containing proteins, cytochrome P450s, and nitrated proteins. Our system is, therefore, able to detect classes of proteins with unique absorbance outside the main 214/280 nm range. Further applications of this system will include detection assays for the numerous PTMs that foretell oxidative stress and modification, as well as a whole host of disease states. The challenge is to find specific chemistry that targets particular modifications with specific absorbance and is amenable to HPLC. We have shown that nitration, phosphorylation, and carbonylation are possible with this system, however there is much that can be envisioned to expand the understanding of oxidative stress and the biology of PTMs. For instance, separating phosphotyrosines, phosphothreonines and phosphoserines, and many types of carbonylations from the broad applications shown in this work. Some of these more specific modifications have been dealt with by spotting specific fractions on membranes and probing with specific antibodies or by digesting proteins and identifying the peptides containing modifications with various types of mass spectral analysis.
Figure 6. PF2D-PDA resolution of phosphoproteins of a mouse liver extract derivatized by ProQ®Diamond LC.
A ProQ®Diamond LC modified young mouse liver extract (~0.5 mg) was applied to the PF2D-PDA. (A) A 2nd dimensional reverse phase chromatogram at 214 nm demonstrates the resolution of a total protein extract at 214 nm; (B) the scan of the same sample at 580 nm detects the ProQ derivatized phosphoproteins; (C) A contour map of the PF2D-PDA scan of the ProQ-derivatized mouse liver extract demonstrating the distribution of proteins throughout the scan
Detection of nitrotyrosine-modified proteins
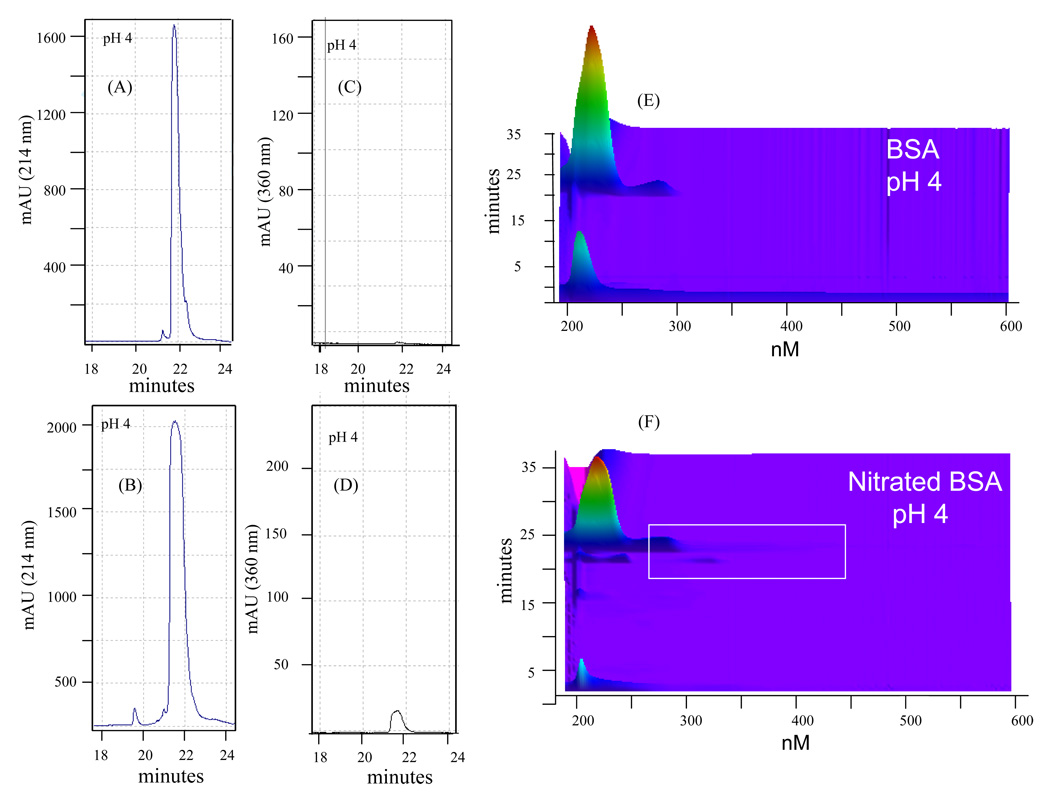
It has been reported that nitration of tyrosine residues occurs either as reversible modifications associated with potential signaling functions (18) or irreversible modification due to oxidative damage (8, 19). Under conditions of acidic pH, nitrated tyrosine residues generate a signature absorbance of the modified protein at 360 nm (20). To demonstrate the ability of the PF2D-PDA system to simultaneously detect nitrated proteins at 214 nm and 360 nm, we prepared and fractionated nitrated BSA and lysozyme. The data in Figure 7 show the fractionation of unmodified BSA at 214 nm (A) and at 360 nm (C); a similar fractionation of nitrated BSA shows a slight shift in the absorbance profile of the modified protein detected at 214 nm compared to the unmodified BSA (Fig. 7B). The nitrated albumin is also detected at 360 nm (Figure 7D), and its elution time is at ~21.5 minutes. These data suggest that the modification does not significantly alter the absorbance profile of unmodified vs. modified albumin. However, the contour maps show that at pH 4.0 the nitrated albumin can be detected as a broad peak which suggests significant change in the protein’s properties due to the modification (Fig. 7E, 7F). Such changes are likely brought about by the heterogenic nature of the tyrosine residues that are modified. A mass analysis using electrospray ionization on digested nitrated and nonnitrated BSA revealed varying levels of nitration on peptides that contained tyrosine residues (data not shown). When these data were compared to similar analysis by Lee et al. and Petersson et al. (21, 22) it was found that there were many nitrated peptides in common but also some that were unique to the particular study. This may be due in part by the methods employed to modify the protein, the instrumentation used in the analysis, or other unknown factors. The Lee and Petersson studies used tetranitromethane (TNM) while our studies employed peroxynitrite treated BSA which reflects the in vivo type of modification though not the in vivo levels. The Petersson study reported only 4 out of 21 tyrosine modified and very low levels of a fifth, this despite using the strong nitrating agent TNM. The Lee study reported 16 modified tyrosines but also included peptides that were nitrated and further modified in other ways. Our study revealed 11 modified tyrosines from nitrated BSA and one from BSA that was not modified (data not shown).
Figure 7. The PF2D-PDA detection of nitrated BSA.
The simultaneous detection of BSA at (A) 214 nm and (C) 360 nm, and nitrated BSA at (B) 214 nm and (D) 360 nm. (E) The contour maps of the PF2D-PDA scan (190–600 nm) of BSA and (F) nitrated BSA.
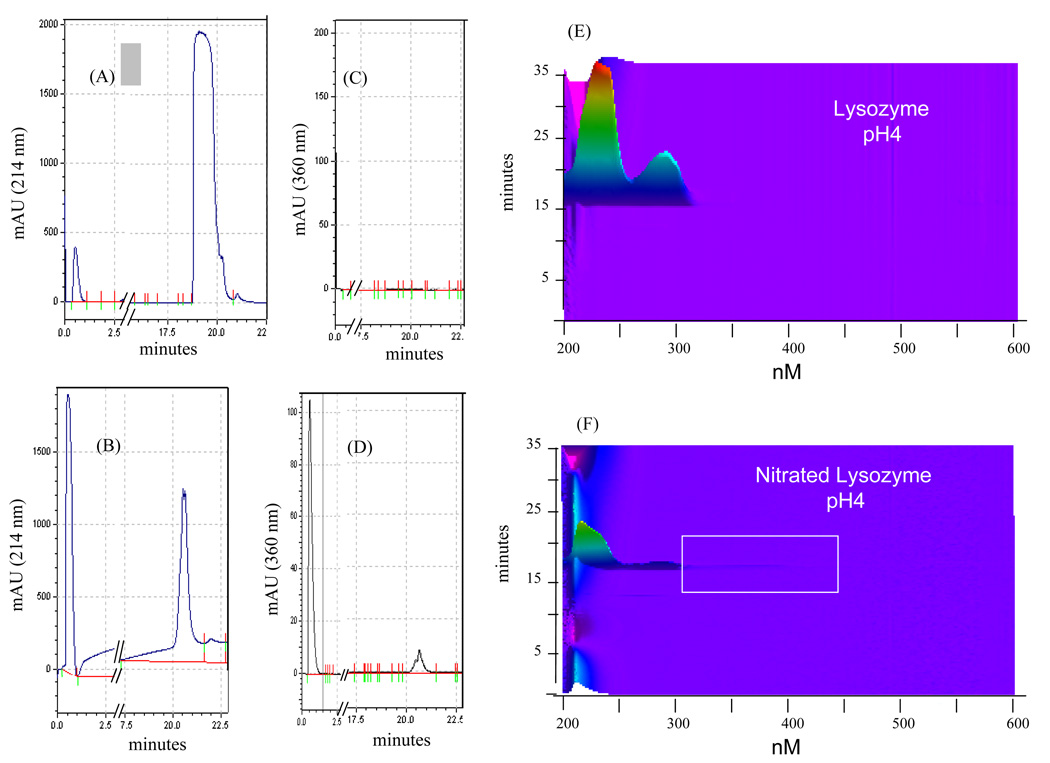
Experiments with nitrated lysozyme exhibit the same absorbance patterns at 214 nm and 360 nm (Fig. 8A–8D). As observed with albumin, lysozyme also exhibits a broad peak when nitrated (Figure 8E, 8F).
Figure 8. The PF2D-PDA detection of nitrated lysozyme.
The simultaneous detection of lysozyme at (A) 214 nm and (B) 360 nm; and nitrated lysozyme at (C) 214 nm and (D) 360 nm. (E) The contour maps of the PF2D-PDA scan (190–600 nm) of lysozyme and (F) nitrated lysozyme.
Detection of nitrotyrosine-modified proteins in mouse liver homogenates
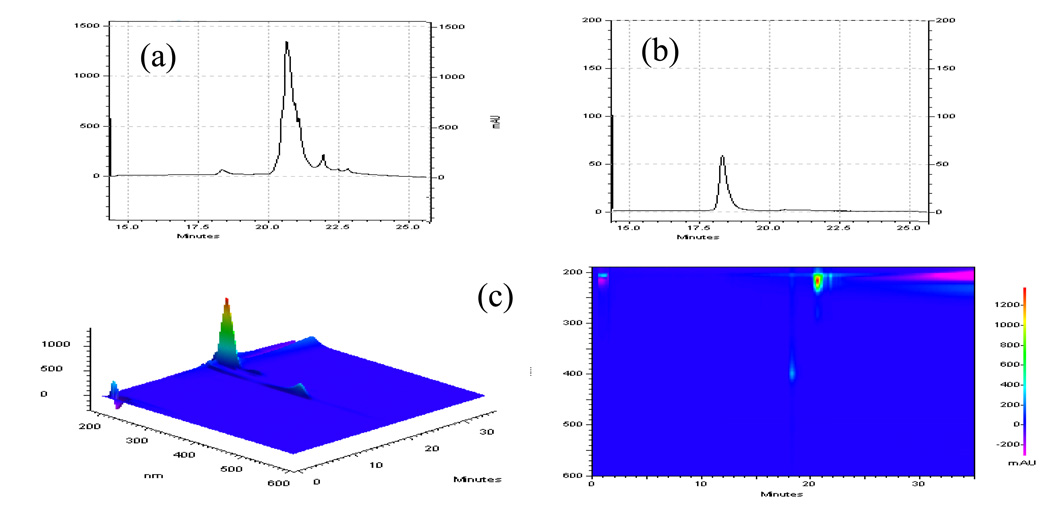
Creatine kinase (CK) is one of the nitrated proteins found in aged mouse quadriceps homogenate. Absorbance signatures of nitrated and non-nitrated CK at 214nm (a) and from the PDA scan (c) are shown in Figure 9. Nitrated CK is shown at absorbance 360nm in panel (c). The offset of the nitrated signal from the non-nitrated signal at 214nm from 18.3minutes to 20.5 minutes clearly shows the level of nitrated CK in vivo. Thus, our system has the potential to detect and quantify levels of PTM.
Figure 9. The PF2D-PDA detection of vivo nitrated muscle protein creatine kinase.
The simultaneous detection of signatures of nitrated and non-nitrated CK at 214 (a) and from the PDA scan (c). Nitrated CK is shown at absorbance 360nm in panel (b). The offset of the nitrated signal from the non-nitrated signal at 214nm from 18.3minutes to 20.5 minutes shows the level nitrated CK in vivo compared to non-nitrated.
Discussion
Conventional methods of two dimensional protein fractionation are time consuming and laborious to the extent that the fractionated proteome is limited to spot by spot analysis. Alternatively two dimensional HPLC with UV monitoring allows for fraction archiving, spectral characterization, and rapid western analysis. We have demonstrated that in concordance with fractionation, whole proteomes can be characterized as to their carbonylated, nitrated and phosphorylated modifications. We have shown that proteins such as cytochromes with unique spectral signatures can also be identified and quantified. Furthermore, we have utilized a rapid method of western analysis as applied to whole or defined proteomes. The ability to characterize a proteome is to further understand the global biology of the organism. The significance (and role) of PTMs in the development of physiological characteristics such as embryonic and fetal development, aging, diseases and responses to environmental factors can be achieved rapidly by the systems described here.
Our studies have introduced a spectrophotometric detection system which facilitates the simultaneous detection of proteins with modification-induced changes in absorbance that occur within the range of 190–600 nm. The resultant modifications and applications to this system facilitate the rapid high throughput construction of multiple proteome-maps that include overall protein maps at 214/280 nm and maps of modified proteins ranging from 190–600 nm.
In conclusion, we envision the application of this system for the detection and identification of many potential chemical modifications and derivatizations that would facilitate the visualization of PTMs simultaneously thus expanding characterization of specific proteomes.
Abbreviations
- CF
Anion Exchange Chromatofocusing
- 2-DE
two dimensional gel electrophoresis
- PDA
Beckman System Gold 168 Photo Diode Array Detector
- PF2D
Beckman Coulter PF2D ProteomeLab
- PTM
Post-translational modification
- RP
Reverse Phase Chromatography
Footnotes
This publication was supported by U.S.P.H.S. grants 1P01 AG 021830-01 awarded by the National Institute on Aging, The University of Texas Medical Branch Claude D. Pepper Older Americans Independence Center, P60AAG12583, The Sealy Center on Aging, University of Texas Medical Branch, a grant from The Clayton Foundation for Research, and Beckman-Coulter, Inc.
REFERENCES
- 1.Rifai N, Gillette MA, Carr SA. Protein biomarker discovery and validation: the long and uncertain path to clinical utility. Nat. Biotechnol. 2006;5.10:971–983. doi: 10.1038/nbt1235. [DOI] [PubMed] [Google Scholar]
- 2.Krueger KE, Srivastava S. Posttranslational protein modifications. Current implications for cancer detection, protection, prevention, and therapeutics. Molecular & Cellular Proteomics. 2006;5.10:1799–1810. doi: 10.1074/mcp.R600009-MCP200. [DOI] [PubMed] [Google Scholar]
- 3.Mayr M, Zhang J, Greene AS, Gutterman D, Perloff J, Ping P. Proteomics-based development of biomarkers in cardiovascular disease. Molecular & Cellular Proteomics. 2006;5.10:1853–1864. doi: 10.1074/mcp.R600007-MCP200. [DOI] [PubMed] [Google Scholar]
- 4.Kobeissy FH, Ottens A, Zhang Z, Liu MC, Denslow ND, Dave JR, Tortella FC, Hayes RL, Wang KKW. Novel differential neuroproteomics analysis of traumatic brain injury in rats. Molecular & Cellular Proteomics. 2006;5.10:1887–1898. doi: 10.1074/mcp.M600157-MCP200. [DOI] [PubMed] [Google Scholar]
- 5.Liu T, Qian W-J, Gritsenko MA, Xiao W, Moldawer LL, Kaushal A, Monroet ME, Varnum SM, Moore RJ, Purvine SO, Maier RV, Davis RW, Tompkins RG, Camp DG, II, Smith RD. High dynamic range characterization of the trauma patient plasma proteome. Molecular & Cellular Proteomics. 2006;5.10:1899–1913. doi: 10.1074/mcp.M600068-MCP200. [DOI] [PMC free article] [PubMed] [Google Scholar]
- 6.Nedelkov D, Kiernan UA, Kiederkofler EE, Tubbs KA, Nelson RW. Population Proteomics. The concept, attributes, and potential for cancer biomarker research. Molecular & Cellular Proteomics. 2006;5.10:1811–1818. doi: 10.1074/mcp.R600006-MCP200. [DOI] [PubMed] [Google Scholar]
- 7.De Lany JP, Floyd ZE, Zvonic S, Smith A, Gravois A, Reiners E, Xiying W, Kilroy G, Lefevres M, Gimble JM. Proteomic analysis of primary cultures of human adipose-derived stem cells. Molecular & Cellular Proteomics. 2005;4.6:731–740. doi: 10.1074/mcp.M400198-MCP200. [DOI] [PubMed] [Google Scholar]
- 8.Kanski J, Behring A, Pelling J, Schoneich C. Proteomic identification of 3-nitrotyrosine containing rat cardiac proteins: effects of biological aging. Am. J. Physiol. Heart Circ. Physiol. 2005;288:H371–H381. doi: 10.1152/ajpheart.01030.2003. [DOI] [PubMed] [Google Scholar]
- 9.Lee I-N, Chen C-H, Sheu J-C, Lee H-S, Huang G-T, Yu Y-Y, Lu F-J, Chow L-P. Identification of human heptocellular carcinoma-related biomarkers by two-dimensional difference gel electrophoresis and mass spectrometry. J. Proteome Res. 2005;4:2962–2069. doi: 10.1021/pr0502018. [DOI] [PubMed] [Google Scholar]
- 10.Shin JS, Lee JJ, Lee EJ, Kim YH, Chae KS, Kim CW. Proteome analysis of rat pancreas induced by pancreatectomy. Biochim. Biophys. Acta. 2005;1749:23–32. doi: 10.1016/j.bbapap.2005.02.003. [DOI] [PubMed] [Google Scholar]
- 11.Choksi KB, Boylston WH, Rabek JP, Widger WE, Papaconstantinou J. Oxidatively damaged proteins of heart mitochondrial electron transport complexes. Biochim. Biophys. Acta. 2004;1688:95–101. doi: 10.1016/j.bbadis.2003.11.007. [DOI] [PubMed] [Google Scholar]
- 12.Rabek JP, Boylston WH, Papaconstantinou J. Carbonylation of ER chaperone proteins in aged mouse liver. Biochem. Biophys. Res. Commun. 2003;305:566–572. doi: 10.1016/s0006-291x(03)00826-x. [DOI] [PubMed] [Google Scholar]
- 13.McDonald T, Sheng S, Stanley B, Chen D, Ko Y, Cole RN, Pedersen P, Van Eyk J. Expanding the subproteome of the inner mitochondria using protein separation technologies: one and two dimensional chromatography and two-dimensional gel electrophoresis. Molecular & Cellular Proteomics. 2006;5:2392–2411. doi: 10.1074/mcp.T500036-MCP200. [DOI] [PubMed] [Google Scholar]
- 14.Van den Bergh G, Archens L. Recent advances in 2D electrophoresis; an array of possibilities. Expert. Rev. Proteomics. 2005;2:243–252. doi: 10.1586/14789450.2.2.243. [DOI] [PubMed] [Google Scholar]
- 15.Levine RL, Williams JA, Stadtman ER, Schacter E. Carbonyl assays for determination of oxidatively modified proteins. Methods in Enzymol. 1994;233:346–357. doi: 10.1016/s0076-6879(94)33040-9. [DOI] [PubMed] [Google Scholar]
- 16.Bian K, Gao Z, Weinsbrodt N, Murad F. The nature of heme/iron-induced protein tyrosine nitration. Proc. Natl. Acad. Sci. USA. 2003;100(10):5712–5717. doi: 10.1073/pnas.0931291100. [DOI] [PMC free article] [PubMed] [Google Scholar]
- 17.Fisher SE, Whitt GS. Purification of the creatine-kinase isozymes of the green sunfish (Lepomis-Cyanellus) with Blue Sepharose C1-6B. Anal Biochem. 1979;94:89–95. doi: 10.1016/0003-2697(79)90794-2. [DOI] [PubMed] [Google Scholar]
- 18.Koech T, Fu X, Hazen SL, Crabb JW, Stuehr DJ, Aulak KS. Rapid and Selective Oxygen-regulated Protein Tyrosine Denitration and Nitration in Mitochondria. J Biol. Chem. 2004;279(26):27257–27262. doi: 10.1074/jbc.M401586200. [DOI] [PubMed] [Google Scholar]
- 19.Adams S, Green P, Claxton R, Simcox S, Williams MV, Wash K, Leeuwenburg C. Reactive carbonyl formation of oxidative and non-oxidative pathways. Frontiers in Biosci. 2001;6:A17–A24. doi: 10.2741/adams. [DOI] [PubMed] [Google Scholar]
- 20.De Filippis V, Frasson R, Fontana A. 3-Nitrotyrosine as a spectroscopic probe for investigating protein protein interactions. Protein Sci. 2006;15:976–986. doi: 10.1110/ps.051957006. [DOI] [PMC free article] [PubMed] [Google Scholar]
- 21.Lee JS, Lee JR, Kim YH, Park YS, Park SI, Park HS, Kim KP. Investigation of tyrosine nitration and nitrosylation of angiotensin II and bovine serum albumin with electrospray mass spectrometry. Rapid Commun. Mass Spectrom. 2007;21:2797–2804. doi: 10.1002/rcm.3145. [DOI] [PubMed] [Google Scholar]
- 22.Petersson A, Steen H, Kalume DE, Caidahl K, Roepstorff P. Investigation of tyrosine nitration in proteins by mass spectrometry. J. Mass Spectrom. 2001;36:616–625. doi: 10.1002/jms.161. [DOI] [PubMed] [Google Scholar]


