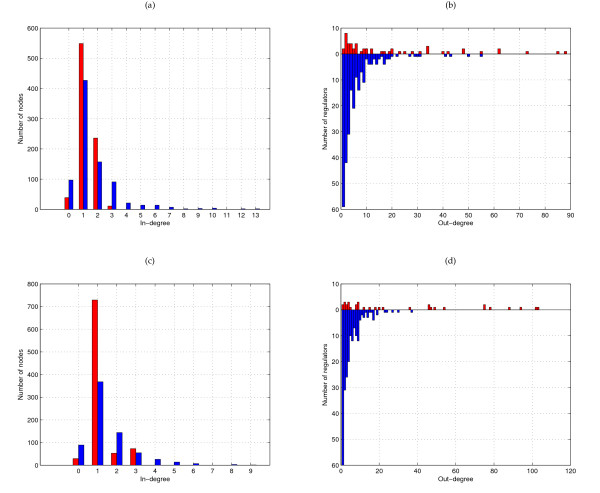
Figure 2.
In- and out-degree distributions of LeMoNe and CLR networks. (a) E. coli in-degree distribution for LeMoNe (red) and CLR (blue) at 30% precision threshold. (b) E. coli out-degree distribution for LeMoNe (red) and CLR (blue) at 30% precision threshold. (c) S. cerevisiae in-degree distribution for LeMoNe (red) and CLR (blue) at first 1070 predictions. (d) S. cerevisiae out-degree distribution for LeMoNe (red) and CLR (blue) at first 1070 predictions.

