Abstract
We use plasmon coupling between individual gold nanoparticle labels to monitor sub-diffraction limit distances in live cell nanoparticle tracking experiments. While the resolving power of our optical microscope is limited to ~500 nm, we improve this by more than an order of magnitude by detecting plasmon coupling between individual gold nanoparticle labels using a ratiometric detection scheme. We apply this plasmon coupling microscopy to resolve the interparticle separations during individual encounters of gold nanoparticle labeled fibronectin-integrin complexes in living HeLa cells.
Single particle tracking is an important tool to investigate dynamic biological processes by following the movement of individual labeled molecules with high spatial and temporal resolution. By tracking the movement of particle labeled plasma membrane components deep insights into the dynamic properties of membrane domains and the signaling mechanisms of different surface receptors were obtained.1–4 Single particle tracking has also been indispensable to unravel the working mechanism of different molecular motors in vitro5–7 and recently also in vivo.8–12 Another field where “particle” tracking has enabled significant scientific progress lies in the area of virus trafficking. Single virus tracking in living cells has revealed many details of the interactions between viruses and cellular structures and has provided us with a better understanding of the molecular mechanisms of viral infection.13–15 Finally, nanoparticle tracking has also been successfully applied to monitor cell developmental processes in vivo.16
These examples highlight the wide use of single particle tracking as a tool in biophysics and cell biology. Part of the appeal of the technology is that despite its relative simplicity – in its basic form it requires only a microscope and a camera – localization of individual particles with high spatial and temporal resolution can be achieved in a wide-field microscope. The spatial precision with which an isolated particle can be localized is limited only by the number of photons that are collected per time unit.17 Particles with large optical cross-sections are therefore advantageous for achieving a high spatial resolution with high temporal bandwidth. 40 nm gold nanoparticles are efficient light scatterers which have long been used as probes in single particle tracking applications.5 Recently, Nan et al. demonstrated tracking of individual gold nanoparticles with a spatial resolution of ~1.5 nm at 25 μs temporal resolution in vivo.10 The excellent optical properties of the gold nanoparticles result from the resonant excitation of collective oscillations of the particles’ free electrons, also called surface plasmons, which cause large optical cross-sections at their respective resonance wavelengths.18,19 Gold nanoparticles are not only very bright they also display an extreme photophysical stability. Since their signal is based on light scattering, gold nanoparticles do not blink or bleach and enable – unlike fluorescent dyes or quantum dots – continuous, intermittence free observation without limitations in total observation time. While individual, isolated nanoparticle can be localized with nanometer spatial precision, the resolution in discerning two identical particles is limited by the diffraction limit to ~250 nm at best in the visible. One constraint of conventional single particle tracking methods is therefore the inability to detect short-range interactions between multiple labeled molecules. These short range interactions play a pivotal role in virtually all cellular processes that involve transient interactions between multiple components. In order to unravel the complex mechanisms that govern dynamic biological processes, imaging tools are desirable that enable the tracking of individual components with high spatial and temporal resolution and in addition facilitate the monitoring of distances on the nanometer scale. Multicolor colocalization of single fluorescent probes is a viable approach to overcome this problem in cases where the interactions of two different moieties labeled with two distinct colors are investigated.20–23 However, this approach fails for discerning interactions between identical labels. This limitation has spurred the development of different ultra-resolution fluorescent microscopy techniques that can distinguish identical fluorescent items with subdiffraction limit resolution.24–28 Despite the exciting possibilities that these superresolution methods offer for cell biology, the tracking of several individual objects in living cells with subdiffraction spatial resolution remains a significant challenge. In addition like any other fluorescence microscopy, superresolution methods are subject to the constraints in continuous observation time that result from the limited photostability of the fluorescent probes. For those superresolution methods that require the use of high-intensity pulsed lasers this is an even greater concern.
Herein we explore an alternative approach to track individual objects in living cells with high temporal bandwidth and spatial precision, which is not limited in observation time, and is capable of detecting interactions between identically labeled objects on sub-diffraction length scales. We augment conventional gold nanoparticle tracking with the capability to probe distances below the diffraction limit using the distance dependent near-field interactions between individual gold particles. Plasmons of individual particles can interact with each other over tens of nanometers29–32 and although these interactions occur in the near-field, plasmon coupling can be detected in the far-field as a shift in the resonance wavelength of the interacting particles.33 We apply this technology here to monitor the interactions between individual gold nanoparticles on the plasma membrane of living HeLa cells.
Plasmon Coupling Microscopy
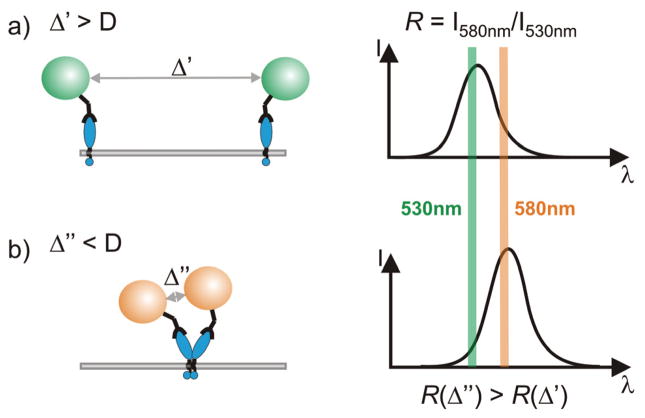
Individual noble metal nanoparticles with diameters of approximately 30 nm and above can be detected in an optical microscope provided that the scattered light of the particles can be separated from the excitation light. This is typically achieved using either darkfield or total internal reflection (TIR) illumination. Several groups have used these approaches in the past to investigate the intriguing optical properties of noble metal nanoparticles and their dependence on the size, shape and composition of the particles.34–37 The plasmons of close by particles couple in a distance dependent fashion; the plasmon resonance wavelength λres red-shifts with decreasing interparticle distance.38,39 The quantification of the distance dependence of the plasmon coupling relationship between individual nanoparticles has been of great interest recently.29–31,40 These studies have revealed that the effect of plasmon coupling becomes substantial when the gap between the two particles is comparable to or less than the particle diameter D. Consequently, for 40 nm gold nanoparticle labels diffusing on the surface of a cell we anticipate a significant red-shift of λres to occur when two particles approach within 40 nm of each other (see Figure 1). Plasmon coupling microscopy combines conventional particle tracking with a ratiometric analysis of the scattered light to detect these spectral shifts between individual particles. We obtain both spatial and ratiometric spectral information as function of time through simultaneous particle tracking on two separate color channels. A two-color tracking enables the detection of red-shifts in λres between close-by particles as changes in the ratio R of the particles’ intensities on the two monitored wavelength channels (see Figure 1).
Figure 1.
Gold nanoparticle labeled surface receptors (left) and and spectral signature (right) as function of interparticle distance. a) For interparticle separations Δ larger than the particle diameter D, the near-field interactions between the particles is small and the resonance wavelength λres is that of an individual particle. b) For interparticle separations Δ < D the plasmons in the individual particles couple and the resonance wavelength λres red-shifts with decreasing separation. This spectral shift is observable as an increase in the intensity ratio R = I580nm/I530nm.
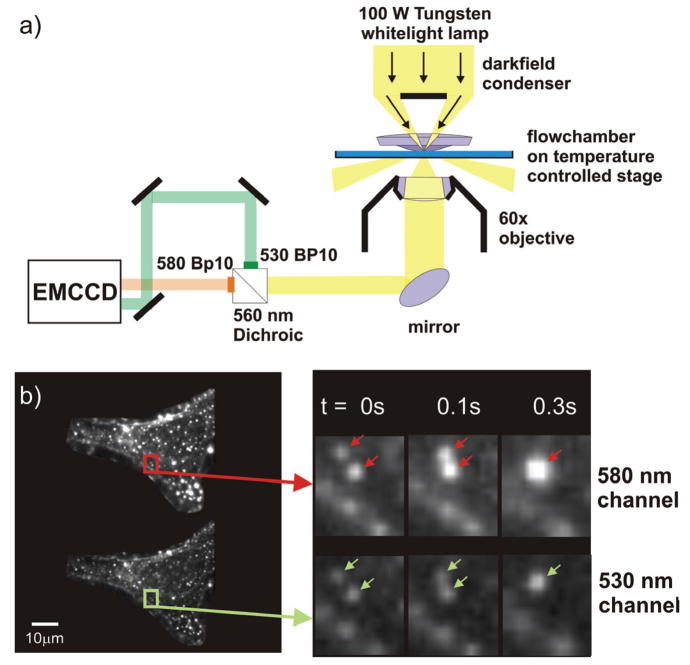
Our set-up (see Figure 2a) is based on an inverted darkfield microscope with temperature controlled stage that is augmented with a dual color detection scheme which facilitates the simultaneous recording of two monochromatic images of the same field of view. Figure 2b contains images of a gold nanoparticle labeled HeLa cell simultaneously recorded on a 530 nm and 580 nm channel. The particles bound to the cell surface are not stationary but move as function of time as illustrated for two particles (marked by arrows). At t = 0.3 s the two particles optically colocalize and can no longer be distinguished with conventional light microscopy. Our aim is to use a ratiometric analysis of the collected light to detect spectral shifts indicative of near-field interactions between the particles and thus to provide additional information about the actual interparticle separation during colocalization.
Figure 2.
a) Experimental set-up. Individual gold nanoparticles are tracked in an inverted dark-field microscope. The collected light is chromatically separated, bandpass filtered (580 BP10 and 530 BP 10), and captured on two translated areas of the same camera (EMCCD) b) Image of a gold nanoparticle labeled HeLa cell recorded simultaneously on two monochromatic color channels: 580 nm (top) and 530 nm (bottom). The time series shows the diffusion of two particles on the plasma membrane. At t = 0.3 s the particles colocalize and are no longer optically resolvable.
In our set-up the samples are illuminated with unpolarized white light at oblique angles. The scattered light is collected by a 60× (numerical aperture, NA = 0.65) objective and chromatically separated by a dichroic longpass filter (560 nm). After the two beams have passed separate bandpass filters they are reimaged on translated areas of the same electron multiplying charge coupled device (EMCCD). We use an Andor IxonEM+ with a maximum detection area of 512 × 512 pixels and a pixel size of 16μm × 16μm. The active area of the detector is adjustable; in a typical experiment the active area is chosen to contain only the cell of interest displayed on both channels and is typically on the order of 150 × 150 pixels. With these settings we can monitor diffusion of individual particles on the plasma membrane with a temporal resolution of 10Hz. The peak intensities and positions of the individual particles on the two color channels are obtained by curve fitting the recorded images using a surface fitting algorithm41.
The choice of the bandpass filters is dictated by the spectral characteristics of the used noble metal nanoparticle probes. We anticipated that a suitable filter combination should include one bandpass filter centered at the resonance wavelength of the individual particles and a second filter that is centered at the resonance of a dimer with short interparticle separation. For the experiments reported here we used 40 nm gold nanoparticles as labels which have a plasmon resonance of λres ≈ 535 nm in our imaging buffer (Hanks’ balanced salt solution (HBSS) with 11 mM Mg2+, 1 mM Ca2+, and 10 mM HEPES pH7.2). We know from previous investigations of the λres versus separation relationship that for 40 nm gold nanoparticle pairs with an interparticle separation of 10 nm the plasmon resonance wavelength is approximately λres ≈ 580 nm.42 Based on these considerations we chose a combination of 530 nm and 580 nm bandpass filters to detect plasmon coupling between individual gold nanoparticles.
Sensitivity of Ratiometric Distance Detection
We first verified that the ratiometric detection approach with the chosen filter combination is appropriate to detect interparticle distance changes on the nanometer scale in a series of control experiments. We assembled dimers of 40 nm gold nanoparticles using a DNA programmed self-assembly procedure and anchored one particle of each dimer to the surface of a flowchamber while the other particle was free to move in solution (see Materials and Methods, Supporting Information).43 We then monitored the ratio R of the light scattered off the individual dimers while we induced changes in the interparticle separation.43–45 Dendrimer induced dimer collapse and enzymatic cleavage of the RNA tether enabled us to measure R for three configurations: for dimers with intact DNA tether, for dimers with compacted DNA and for monomers (dimers with infinite interparticle separation). According to the worm-like chain model46 the end-to-end distance of the 50 base pairs DNA spacer used in this study is approximately 15 nm. This distance is significantly reduced upon addition of the dendrimers. Due to a passivating polyethylene glycol (PEG) brush around the gold nanoparticles, the minimum interparticle separation in the collapsed dimers is ~6 nm (see Materials and Methods, Supporting Information).43 According to a previous calibration of the λres vs. interparticle separation (Δ), the relevant plasmon resonance wavelength are then: λres(Δ = ∞) ≈ 537 nm, λres(Δ = 15 nm) ≈ 568 nm, λres(Δ = 6 nm) ≈ 621 nm.42
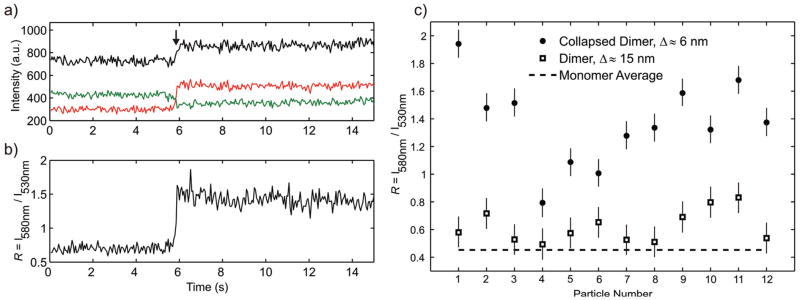
Figure 3a contains trajectories for the 580 nm and 530 nm intensity channels recorded during the collapse of an individual gold nanoparticle dimer which is indicated by a sudden increase in total scattering intensity. The sudden compaction of the dimer is induced by addition of 4th generation Polyamidoamine (PAMAM) dendrimers. The highly positively charged dendrimers – the 4th generation dendrimer has nominally a positive charge of q = +64 − bind to the negative surface of the nanoparticles and to the negatively charged DNA backbone, effectively reducing the interparticle repulsion and compacting the DNA tether. The resulting drop in the interparticle separation leads to a strong increase in the interparticle coupling and red-shifts the plasmon resonance of the dimer. Consequently, the intensity recorded on the red-shifted intensity channel, I580nm, increases and the intensity on the green channel, I530nm, decreases. Figure 3b contains the computed intensity ratio R = I580nm/I530nm as function of time. The average R value increases from ~0.4 before compaction to ~0.8 for the collapsed dimer after addition of dendrimer. Not all of the dimers in the field of view were active and showed a strong increase in total scattering intensity indicative of compaction. The non-responsive particle assemblies served as internal control to approximate the effect of the change in the refractive index upon dendrimer addition. The observed R changes (see Figure S1, Supporting Information) confirm that the spectral response for the active dimers is dominated by the change in interparticle separation.
Figure 3.
Ratiometric detection of interparticle distance changes. a) Intensities I580nm (red), I530nm (green), and total intensity (black) recorded during dendrimer induced collapse of a pair of DNA (50 base pairs) tethered gold nanoparticles (“dimer”). Upon collapse, marked by the arrow, I580nm increases while I530nm decreases, indicative of a spectral red-shift. b) Corresponding intensity ratio R = I580nm/I530nm during dimer collapse. c) Time-averaged intensity ratiosR for twelve dimers before and after dendrimer induced collapse. The average interparticle separation before compaction is Δ ≈ 15 nm and Δ ≈ 6 nm after compaction (see text). In all cases we observe a significant increase in R upon compaction. The average R value calculated from 30 monomers is included as dashed line.
Figure 3c gives an overview of R before and after compaction for twelve different dimers. In all cases R is significantly higher after collapse, the average R values for the dimers before (Rdim) and after compaction (Rcomp) are Rdim = 0.62 and Rcomp = 1.37. We also included the average Rmon = 0.45 for 40 nm gold nanoparticle monomers as dashed line in Figure 3c. Rmon was computed from the I580nm/I530nm ratios of 30 individual 40 nm gold nanoparticles measured under identical conditions as the dimers. The average shift of the intensity ratios before and after dimer collapse is ΔRdim = Rcomp − Rdim = 0.75, the shift between dimers and monomers is ΔRmon = Rdim − Rmon = 0.17. Due to the distance dependent decay of the plasmon coupling in noble metal nanoparticles ΔRdim is much larger than ΔRmon. As discussed elsewhere29,40,42 the difference in λres between coupled dimers and non-interacting particles decays exponentially with interparticle separation.
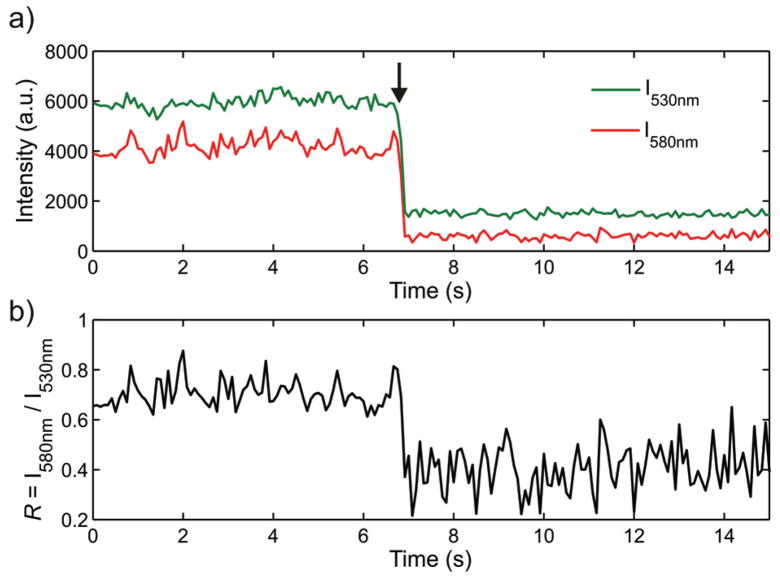
The obtained average shift in R between monomers and dimers is smaller than that between dimers and collapsed dimers. However, it is evident from Figure 3c that all observed Rdim values lie higher than Rmon indicating that the chosen filter combination is also capable of discerning monomers from DNA tethered dimers. We anticipate that if variations in R due to heterogeneities in the size and shape of the used particles are eliminated by following single particle trajectories, individual gold nanoparticles can be unambiguously discerned from weakly interacting gold nanoparticle dimers. This argument is corroborated by the plots of I530nm and I580nm recorded during a DNA cleavage experiment in Figure 4. In this experiment the DNA tethering two gold nanoparticles contains an EcoRV recognition site and is cleaved by the enzyme. Upon DNA cleavage marked by the arrow in Figure 4a, the intensities on both color channels drop steeply as the number of particles is reduced from two to one: Only one of the particles is anchored to the surface, the second particle is free to diffuse away once the DNA tether has been cleaved. In addition to the decrease in scattering cross-section the transition from a dimer to a monomer is accompanied by a blue-shift of the plasmon resonance by approximately Δλres ≈ −31 nm leading to an increase in the relative contribution from the green channel to the spectrum of the scattered light. As indicated in Figure 4b this shift is clearly detected by the drop in R.
Figure 4.
a) Intensities I580nm and I530nm during enzymatic cleavage of the 50 base pairs long DNA spacer tethered between two gold nanoparticles. b) Corresponding ratio R = I580nm/I530nm.
The performed calibration experiments at variable interparticle distances confirm that the chosen filter combination is appropriate to discern non-interacting gold nanoparticles from nanoparticles that have approached each other to within approximately 15 nm. As illustrated by the DNA condensation experiments, distance changes below this threshold lead to strong changes in R due to strong red-shifts of λres. The distance sensitivity of the ratiometric detection approach can be further optimized and tuned by the choice of the applied filter combination. Filter combinations in the green are preferable for a high sensitivity at long interparticle separations whereas filter combinations in the red will lead to an improved spatial resolution at short interparticle separations. For the main goal of this study – the detection of close encounters between gold nanoparticle labeled surface receptors on living cells – the detection threshold at around 15 nm obtained with the chosen 530 nm/580 nm filter set is appropriate.
Resolving Gold Nanoparticle Encounters Below the Diffraction Resolution Limit in Living Cells
Colocalization of individual components is often used in biological imaging as an indication for direct interactions between the labeled components. However, due to the diffraction resolution limit, individual components can be hundreds of nanometers apart and still appear colocalized in conventional light microscopy. In our set-up we used a 60x objective with a NA = 0.65. Under these conditions two individual gold nanoparticles with λres ≈ 535 nm can be discerned optically only if they are separated by more than 500 nm. Plasmon coupling microscopy now offers additional information about very short interparticle separations by detecting the near-field interactions between individual noble metal nanoparticle labels which occur only if the particles have approached each other to within approximately one particle diameter. We applied this approach to detect direct interactions between individual nanoparticle labeled integrin surface receptors on living cells during colocalization. Integrins are a family of cell surface receptors that mediate a series of cell-cell and cell-matrix interactions, for instance with the cell adhesion molecule fibronectin.47–50 We bound fibronectin to integrins on the plasma membrane of a cervical cancer cell line (HeLa) and used 40 nm gold nanoparticles that were functionalized with anti-fibronectin (see Supporting Information) as labels for the integrin bound fibronectin. All experiments were performed in a flowchamber at 37 °C.
In a typical experiment the cells were first incubated with a 0.2 mg/mL solution of fibronectin in imaging buffer for 10 minutes. Then the cells were washed with an excess of imaging buffer and a solution of anti-fibronectin functionalized gold nanoparticles in imaging buffer was added. The concentration of the particles was chosen sufficiently low to allow the tracking of individual particles. We started recording with the addition of gold nanoparticles and detected gold nanoparticle binding from solution in real time. Since the cells always contained some particulate scattering sources we restricted our analysis to gold nanoparticles whose binding from solution was recorded. To confirm that these attachments were caused by specific interactions between the fibronectin and the gold nanoparticle bound antibody, we performed different control experiments. First, we used bovine serum albumin (BSA) functionalized nanoparticles to test the “stickiness” of the cell surface for protein coated nanoparticles. We observed no binding under our experimental conditions. Next, we incubated anti-fibronectin functionalized particles with HeLa cells without prior incubation with fibronectin. Again we did not observe any particle binding, giving confidence that the observed binding was not caused by non-specific membrane – particle interactions but was indeed caused by the antibody binding to its epitope.
To track particles that bound to the cell from solution and to monitor their R value, we fitted the scattering images on the two color channels.41 The obtained fits were then background corrected with fits to nearby areas that were void of nanoparticles. We used the fitted peak intensities on the two color channels I580nm and I530nm to calculate the ratio R = I580nm/I530nm for the individual particles. The spatial coordinates of the individual particles were obtained from the fitted peak position on the 530 nm channel. The surface-mobilities of the nanoparticle labels varied significantly, the observed behaviors varied from immobilization to rapid surface diffusion with diffusion coefficients up to 1.8×10⁻¹⁴ m2/s. It has been observed before that the lateral mobility of individual integrins can vary substantially.51,52 The mobility of the gold nanoparticle labeled fibronectin-integrin complexes on the cell surface depends on the oligomerization state of the integrin and the interactions with the cytoskeleton of the cell.47,48,51,53 We observed that some of the tracked gold nanoparticle labeled fibronectin-integrin complexes approached each other to within the diffraction resolution limit of our microscope so that we could no longer resolve the individual particles optically. Colocalization durations ranged from a single frame to hundreds of frames, in some cases the particles remained colocalized after initial contact for the entire remaining observation period. While for very short colocalization durations we assumed that the vicinity was accidental, different processes can cause longer periods of colocalization. It is conceivable that gold nanoparticle labeled fibronectin-integrin complexes cluster due to direct or mediated short-range interactions. However, alternative processes exist that can account for the optical colocalization which don’t require direct interactions between the integrins. For instance, it has been observed before that membrane spanning proteins can be locally stopped, slowed or temporarily confined due to the compartmentalization of the cell membrane.54 These compartments can have dimensions on the order of the diffraction resolution limit or below. If two nanoparticle labeled fibronectin-integrin complexes get temporarily trapped in the same compartment, they appear colocalized for the time they remain in the same compartment.
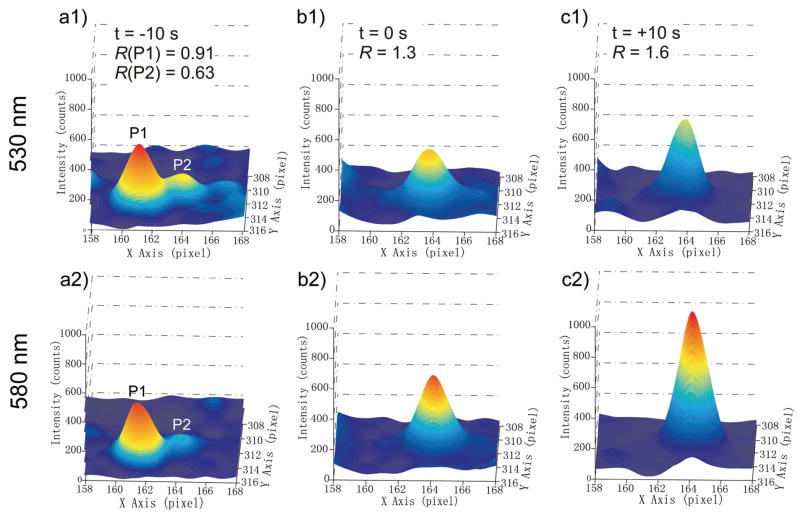
Plasmon coupling offers valuable additional information about the interparticle separation during colocalization; it enables to experimentally probe interactions between the particles that occur only on the tens of nanometer length scale and is therefore a promising tool to unravel the interactions between gold nanoparticle labeled surface receptors. Figure 5 contains an example that illustrates how short range interactions between individual gold nanoparticles can be detected by plasmon coupling on a cell surface. We show the curve fitted images, or point-spread-functions (PSF), for the two particles at three time points during aggregation. In Figure 5a the two particles are still discernable. It is striking that one of the particles (P1) is brighter than the other particle (P2). For both P1 and P2 the intensity is higher on the green than on the red channel, albeit the computed R values imply that λres for P1 is redder than for P2. The differences in the optical properties of P1 and P2 indicate differences in the size and/or shape of the particles. P1 could be a larger spherical particle, an anisotropic particle such as a gold rod, or a small cluster of gold nanoparticles (for instance a dimer). Independent of the exact nature of the individual particles, we observe that their spectral features change when they approach each other. In Figure 5b P1 and P2 are no longer optically discernable; concurrent with the colocalization both the total intensity and the intensity distribution on the two channels change. The peak intensity is now significantly higher on the 580 nm than on the 530 nm channel, and the intensity ratio has increased to R = 1.3. In Figure 5c both the total intensity and the R value reach their maximum. The high R value of R = 1.6 reveals strong interparticle coupling. We continued monitoring of the particles for another 13 minutes and did not observe P1 and P2 to separate again. The observed strong spectral shifts together with the prolonged colocalization are indications for non-reversible short-range interactions between the nanoparticle labeled fibronection-integrin complexes in this case.
Figure 5.
Point spread functions with 0.1 s integration time of two gold nanoparticles (P1 and P2) bound to the surface of a HeLa cell before a) and during colocalization (b) and (c). The top row shows the fitted surface of the image recorded on the 530 nm channel, the bottom row shows the 580 nm channel. The time point of initial colocalization is set to t = 0 s. In a) P1 and P2 are still discernable, whereas in b) the two particles superimpose. Concurrent with the colocalization the relative intensity on the red channel increases; the gain in R indicates a strong red-shift of λres. In c) the total intensity and the R value reach their maxima.
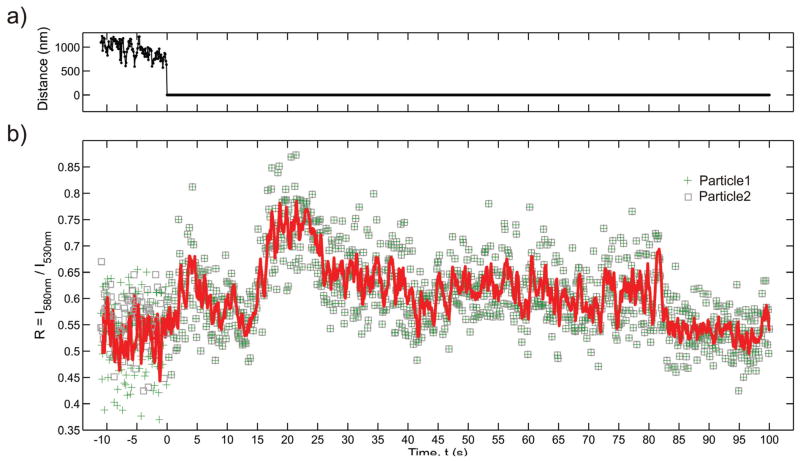
We point out that in the case of the investigated gold nanoparticle labeled fibronectin-integrin complexes prolonged colocalization was not necessarily correlated with a sustained spectral shift. Instead, in many cases we observed fluctuations in the R values on short and long time scales, indicating some dynamic in the average interparticle separations during colocalization. This is illustrated for a pair of particles in Figure 6. Approximately 10 s after the second particle had bound to the cell surface, the two particles “collided” and remained colocalized for over 100 s. In Figure 6 we show the interparticle separation as obtained from the fitted PSFs and the computed R values before and after the collision; the continuous red line in Figure 6b indicates a 5 point sliding average of R. Shortly after colocalization we observe an increase in the average R value from 0.55 to 0.75 in two steps. A first step occurs at t = 1.9 s and a second more prominent follows at t = 16.5 s. The R level remains at R = 0.75 during the interval t = 16.5 s – 25.5 s. Then it drops in two steps, first to R ≈ 0.6 at t = 25.5 s and then to R ≈ 0.55 at t = 82.2 s. At the end of the trajectory the R baseline has reached again a level close to that of the separated particles. The observed fluctuations imply some flexibility in the average interparticle separation. This finding together with the moderate shift in R upon colocalization, implies that the two particles are not non-reversible bound to each other but remain separated. One possible explanation for the behavior observed in Figure 6 is a confinement of the two gold nanoparticle labeled fibronectin-integrin complexes in one membrane compartment.54,55 In case the confined space is sufficiently small, the time average of λres red-shifts due to plasmon coupling between the interacting nanoparticles. Variations in the dimensions of the compartment change the average interparticle separation and therefore lead to systematic shifts in the time average of the plasmon resonance wavelength. Fluctuations of λres on faster time scales result from point-to-point variations of the interparticle separation within the compartment.
Figure 6.
a) Separation of the point spread function centroids and b) R = I580nm/I530nm values for two gold nanoparticle labels diffusing on the surface of a HeLa cell as function of time. The continuous red line in b) is a 5 point sliding average. The two particles optically colocalize at t = 0 s, when the two particles can no longer be distinguished. The observed increase in R after colocalization, most prominently between t = 16.5 s – 25.5 s, indicates that the particles approach each other close enough for plasmon coupling to occur (see text).
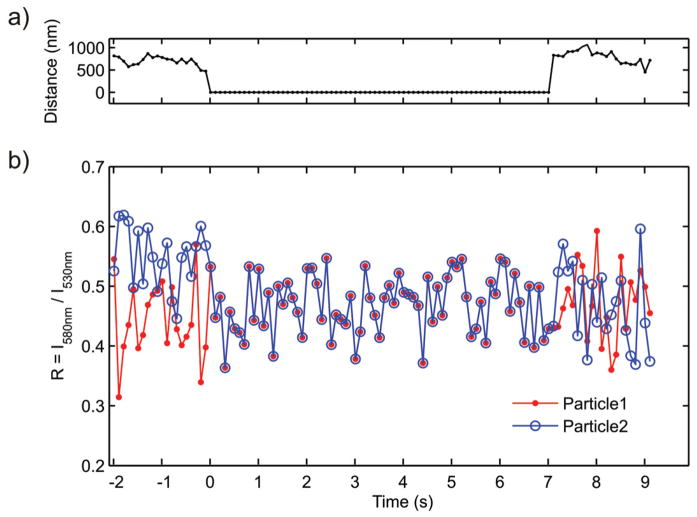
In most cases colocalization lasted much shorter than shown for the examples in Figures 5 and 6. Figure 7 shows an example of a temporary colocalization of two individual gold labels with representative duration. The particles remain colocalized for approximately 7s, then they separate and become optically discernable again. The calculated R values during colocalization show no noticeable differences to the R values of the individual gold nanoparticles prior and after colocalization. For one of the particles (Particle 2) R even slightly decreases upon colocalization. We ascribe this effect to an increase in signal-to-noise; colocalization of two noninteracting gold nanoparticles leads to a gain in “green light” scattered from the diffraction limited spot. Experiments like the one shown in Figure 7 and others in which we tracked individual particles that showed a constant average R value as function time revealed that the refractive index at the cell/medium interface is constant under our experimental conditions.
Figure 7.
a) Separation of the point spread function centroids and b) computed intensity ratios R = I580nm/I530nm for two gold nanoparticle labels, Particle1 and Particle2, that temporarily colocalize as function of time. The point of initial optical colocalization is set to Time = 0 s. The R values do not increase during colocalization; no plasmon coupling is detected.
In summary, our investigations of the interparticle separation of colocalized gold nanoparticle labels using plasmon coupling microscopy show that the nature of the particle interactions during optical colocalization can vary significantly. We observed strong coupling between the gold labels as well as non-interaction even in the case of prolonged colocalization. These findings underline the insufficiency of the colocalization criterion for the unambiguous detection of short-range interactions in particle tracking and the value of plasmon coupling microscopy to overcome this shortcoming.
Conclusions
We have combined single gold nanoparticle tracking with a ratiometric detection of the plasmon resonance wavelength λres to monitor the near-field interactions between individual gold nanoparticles bound to the membrane of living cells. This plasmon coupling microscopy is a wide field microscopy that can track many particles in parallel over large areas and simultaneously monitor sub-diffraction limit distances between the particles. In plasmon coupling microscopy the relative distance information is encoded in the ratiometric color of the scattered light. If two particles approach each other to within coupling range the plasmon resonances red-shift which leads to changes in the ratio R of the two monitored intensity channels. Calibration experiments reveal a detection range of approximately 15 nm with a filter set comprising a pair of bandpass filters centered at 580 nm and 530 nm. We applied this approach to probe the separation between gold nanoparticle labeled integrin surface receptors in living cells that optically colocalize. We find that short-range interactions between the labeled surface groups can occur but is not required for colocalization even in cases of prolonged colocalization. Our studies show that plasmon coupling microscopy is a useful tool for monitoring dynamic interactions between gold nanoparticle labels on subdiffraction length scales. The ability to resolve distances between identical surface groups on the nanometer scale as function of time is of interest for a broad range of cell surface processes where colocalized surface species undergo dynamic or transient interactions which are obscured by the diffraction limit otherwise.
Supplementary Material
Materials and Method and Figure S1. This material is available free of charge via the Internet at http://pubs.acs.org.
Acknowledgments
This work was partially supported by grant 1 R21 EB008822-01 from the National Institute of Health.
References
- 1.Saxton MJ, Jacobson K. Annual Review of Biophysics and Biomolecular Structure. 1997;26:373–399. doi: 10.1146/annurev.biophys.26.1.373. [DOI] [PubMed] [Google Scholar]
- 2.Kusumi A, Nakada C, Ritchie K, Murase K, Suzuki K, Murakoshi H, Kasai RS, Kondo J, Fujiwara T. Annual Review of Biophysics and Biomolecular Structure. 2005;34:351–U54. doi: 10.1146/annurev.biophys.34.040204.144637. [DOI] [PubMed] [Google Scholar]
- 3.Sheetz MP, Turney S, Qian H, Elson EL. Nature. 1989;340:284–288. doi: 10.1038/340284a0. [DOI] [PubMed] [Google Scholar]
- 4.Suzuki KGN, Fujiwara TK, Sanematsu F, Iino R, Edidin M, Kusumi A. Journal of Cell Biology. 2007;177:717–730. doi: 10.1083/jcb.200609174. [DOI] [PMC free article] [PubMed] [Google Scholar]
- 5.Gelles J, Schnapp BJ, Sheetz MP. Nature. 1988;331:450–453. doi: 10.1038/331450a0. [DOI] [PubMed] [Google Scholar]
- 6.Yasuda R, Noji H, Yoshida M, Kinosita K, Itoh H. Nature. 2001;410:898–904. doi: 10.1038/35073513. [DOI] [PubMed] [Google Scholar]
- 7.Muthukrishnan G, Hutchins BM, Williams ME, Hancock WO. Small. 2006;2:626–630. doi: 10.1002/smll.200500223. [DOI] [PubMed] [Google Scholar]
- 8.Kural C, Kim H, Syed S, Goshima G, Gelfand VI, Selvin PR. Science. 2005;308:1469–1472. doi: 10.1126/science.1108408. [DOI] [PubMed] [Google Scholar]
- 9.Watanabe TM, Higuchi H. Biophysical Journal. 2007;92:4109–4120. doi: 10.1529/biophysj.106.094649. [DOI] [PMC free article] [PubMed] [Google Scholar]
- 10.Nan XL, Sims PA, Xie XS. Chemphyschem. 2008;9:707–712. doi: 10.1002/cphc.200700839. [DOI] [PubMed] [Google Scholar]
- 11.Nan XL, Sims PA, Chen P, Xie XS. Journal of Physical Chemistry B. 2005;109:24220–24224. doi: 10.1021/jp056360w. [DOI] [PubMed] [Google Scholar]
- 12.Balci H, Blehm BH, Toprak E, Serpinskaya AS, Gelfand VI, Selvin PR. Biophysical Journal. 2007:527a–527a. [Google Scholar]
- 13.Seisenberger G, Ried MU, Endress T, Buning H, Hallek M, Brauchle C. Science. 2001;294:1929–1932. doi: 10.1126/science.1064103. [DOI] [PubMed] [Google Scholar]
- 14.Babcock HP, Chen C, Zhuang XW. Biophysical Journal. 2004;87:2749–2758. doi: 10.1529/biophysj.104.042234. [DOI] [PMC free article] [PubMed] [Google Scholar]
- 15.Brandenburg B, Zhuang XW. Nature Reviews Microbiology. 2007;5:197–208. doi: 10.1038/nrmicro1615. [DOI] [PMC free article] [PubMed] [Google Scholar]
- 16.Lee KJ, Nallathamby PD, Browning L, Osgood CJ, Xu X. ACS Nano. 2007;1:133–143. doi: 10.1021/nn700048y. [DOI] [PMC free article] [PubMed] [Google Scholar]
- 17.Thompson RE, Larson DR, Webb WW. Biophysical Journal. 2002;82:2775–2783. doi: 10.1016/S0006-3495(02)75618-X. [DOI] [PMC free article] [PubMed] [Google Scholar]
- 18.Kreibig U, Vollmer M. Optical Properties of Metal Clusters. Springer–Verlag; Berlin: 1995. [Google Scholar]
- 19.Kelly KL, Coronado E, Zhao LL, Schatz GC. Journal of Physical Chemistry B. 2003;107:668–677. [Google Scholar]
- 20.Lacoste TD, Michalet X, Pinaud F, Chemla DS, Alivisatos AP, Weiss S. Proceedings of the National Academy of Sciences of the United States of America. 2000;97:9461–9466. doi: 10.1073/pnas.170286097. [DOI] [PMC free article] [PubMed] [Google Scholar]
- 21.Churchman LS, Oekten Z, Rock RS, Spudich JA. Biophysical Journal. 2005;88:664a–664a. [Google Scholar]
- 22.Agrawal A, Deo R, Wang GD, Wang MD, Nie SM. Proceedings of the National Academy of Sciences of the United States of America. 2008;105:3298–3303. doi: 10.1073/pnas.0712351105. [DOI] [PMC free article] [PubMed] [Google Scholar]
- 23.Koyama–Honda I, Ritchie K, Fujiwara T, Iino R, Murakoshi H, Kasai RS, Kusumi A. Biophysical Journal. 2005;88:2126–2136. doi: 10.1529/biophysj.104.048967. [DOI] [PMC free article] [PubMed] [Google Scholar]
- 24.Hell SW. Science. 2007;316:1153–1158. doi: 10.1126/science.1137395. [DOI] [PubMed] [Google Scholar]
- 25.Hell SW, Wichmann J. Optics Letters. 1994;19:780–782. doi: 10.1364/ol.19.000780. [DOI] [PubMed] [Google Scholar]
- 26.Betzig E, Patterson GH, Sougrat R, Lindwasser OW, Olenych S, Bonifacino JS, Davidson MW, Lippincott–Schwartz J, Hess HF. Science. 2006;313:1642–1645. doi: 10.1126/science.1127344. [DOI] [PubMed] [Google Scholar]
- 27.Gustafsson MGL. Proceedings of the National Academy of Sciences of the United States of America. 2005;102:13081–13086. doi: 10.1073/pnas.0406877102. [DOI] [PMC free article] [PubMed] [Google Scholar]
- 28.Rust MJ, Bates M, Zhuang XW. Nature Methods. 2006;3:793–795. doi: 10.1038/nmeth929. [DOI] [PMC free article] [PubMed] [Google Scholar]
- 29.Jain PK, Huang WY, El–Sayed MA. Nano Letters. 2007;7:2080–2088. [Google Scholar]
- 30.Rechberger W, Hohenau A, Leitner A, Krenn JR, Lamprecht B, Aussenegg FR. Optics Communications. 2003;220:137–141. [Google Scholar]
- 31.Wei QH, Su KH, Durant S, Zhang X. Nano Letters. 2004;4:1067–1071. [Google Scholar]
- 32.Elghanian R, Storhoff JJ, Mucic RC, Letsinger RL, Mirkin CA. Science. 1997;277:1078–1081. doi: 10.1126/science.277.5329.1078. [DOI] [PubMed] [Google Scholar]
- 33.Maier SA, Brongersma ML, Kik PG, Atwater HA. Physical Review B. 2002;65:193408. [Google Scholar]
- 34.Sonnichsen C, Geier S, Hecker NE, von Plessen G, Feldmann J, Ditlbacher H, Lamprecht B, Krenn JR, Aussenegg FR, Chan VZH, Spatz JP, Moller M. Applied Physics Letters. 2000;77:2949–2951. [Google Scholar]
- 35.Nehl CL, Grady NK, Goodrich GP, Tam F, Halas NJ, Hafner JH. Nano Letters. 2004;4:2355–2359. [Google Scholar]
- 36.Sherry LJ, Chang SH, Schatz GC, Van Duyne RP, Wiley BJ, Xia YN. Nano Letters. 2005;5:2034–2038. doi: 10.1021/nl0515753. [DOI] [PubMed] [Google Scholar]
- 37.Novo C, Gomez D, Perez–Juste J, Zhang ZY, Petrova H, Reismann M, Mulvaney P, Hartland GV. Physical Chemistry Chemical Physics. 2006;8:3540–3546. doi: 10.1039/b604856k. [DOI] [PubMed] [Google Scholar]
- 38.Quinten M, Kreibig U. Applied Optics. 1993;32:6173–6182. doi: 10.1364/AO.32.006173. [DOI] [PubMed] [Google Scholar]
- 39.Storhoff JJ, Lazarides AA, Mucic RC, Mirkin CA, Letsinger RL, Schatz GC. Journal of the American Chemical Society. 2000;122:4640–4650. [Google Scholar]
- 40.Su KH, Wei QH, Zhang X, Mock JJ, Smith DR, Schultz S. Nano Letters. 2003;3:1087–1090. [Google Scholar]
- 41.D’Errico J. Matlab Central. 2005 [Google Scholar]
- 42.Reinhard BM, Siu M, Agarwal H, Alivisatos AP, Liphardt J. Nano Letters. 2005;5:2246–2252. doi: 10.1021/nl051592s. [DOI] [PubMed] [Google Scholar]
- 43.Reinhard BM, Sheikholeslami S, Mastroianni A, Alivisatos AP, Liphardt J. Proceedings of the National Academy of Sciences of the United States of America. 2007;104:2667–2672. doi: 10.1073/pnas.0607826104. [DOI] [PMC free article] [PubMed] [Google Scholar]
- 44.Sonnichsen C, Reinhard BM, Liphardt J, Alivisatos AP. Nature Biotechnology. 2005;23:741–745. doi: 10.1038/nbt1100. [DOI] [PubMed] [Google Scholar]
- 45.Skewis LR, Reinhard BM. Nano Letters. 2008;8:214–220. doi: 10.1021/nl0725042. [DOI] [PubMed] [Google Scholar]
- 46.Kratky O, Porod G. Recueil Des Travaux Chimiques Des Pays–Bas. Journal of the Royal Netherlands Chemical Society. 1949;68:1106–1122. [Google Scholar]
- 47.Nishizaka T, Shi Q, Sheetz MP. Proceedings of the National Academy of Sciences of the United States of America. 2000;97:692–697. doi: 10.1073/pnas.97.2.692. [DOI] [PMC free article] [PubMed] [Google Scholar]
- 48.Auer KL, Jacobson BS. Molecular Biology of the Cell. 1995;6:1305–1313. doi: 10.1091/mbc.6.10.1305. [DOI] [PMC free article] [PubMed] [Google Scholar]
- 49.Hynes RO. Cell. 1992;69:11–25. doi: 10.1016/0092-8674(92)90115-s. [DOI] [PubMed] [Google Scholar]
- 50.Garcia AJ, Boettiger D. Biomaterials. 1999;20:2427–2433. doi: 10.1016/s0142-9612(99)00170-2. [DOI] [PubMed] [Google Scholar]
- 51.Hirata H, Ohki K, Miyata H. Biochimica Et Biophysica Acta–General Subjects. 2005;1723:100– 105. doi: 10.1016/j.bbagen.2005.01.014. [DOI] [PubMed] [Google Scholar]
- 52.Duband JL, Nuckolls GH, Ishihara A, Hasegawa T, Yamada KM, Thiery JP, Jacobson K. Journal of Cell Biology. 1988;107:1385–1396. doi: 10.1083/jcb.107.4.1385. [DOI] [PMC free article] [PubMed] [Google Scholar]
- 53.Pankov R, Cukierman E, Katz BZ, Matsumoto K, Lin DC, Lin S, Hahn C, Yamada KM. Journal of Cell Biology. 2000;148:1075–1090. doi: 10.1083/jcb.148.5.1075. [DOI] [PMC free article] [PubMed] [Google Scholar]
- 54.Tomishige M, Sako Y, Kusumi A. Journal of Cell Biology. 1998;142:989–1000. doi: 10.1083/jcb.142.4.989. [DOI] [PMC free article] [PubMed] [Google Scholar]
- 55.Murase K, Fujiwara T, Umemura Y, Suzuki K, Iino R, Yamashita H, Saito M, Murakoshi H, Ritchie K, Kusumi A. Biophysical Journal. 2004;86:4075–4093. doi: 10.1529/biophysj.103.035717. [DOI] [PMC free article] [PubMed] [Google Scholar]
Associated Data
This section collects any data citations, data availability statements, or supplementary materials included in this article.
Supplementary Materials
Materials and Method and Figure S1. This material is available free of charge via the Internet at http://pubs.acs.org.


