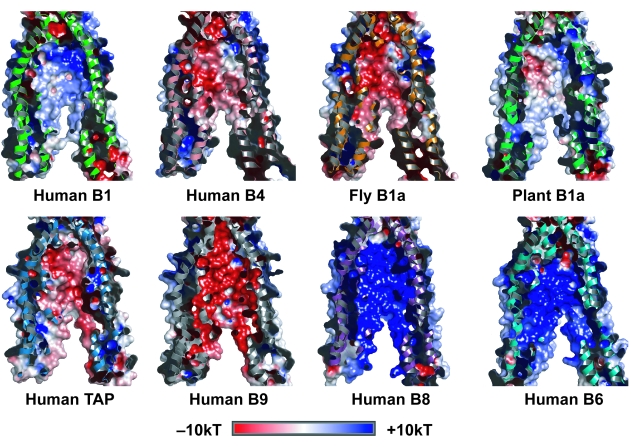
Figure 2.
Comparative summary of electrostatic surfaces for the translocation pathway of representative transporters from human juxtaposed with examples from fly (D. melanogaster) and plant (A. thaliana). The panels are cut away views illustrating part of the surface of the translocation pathway formed by the interface of two half transporter units. Electrostatic potentials from −10 to +10 kT are displayed on the surface; red represents areas of negative electrostatic potential and blue areas represent positive electrostatic potential.

