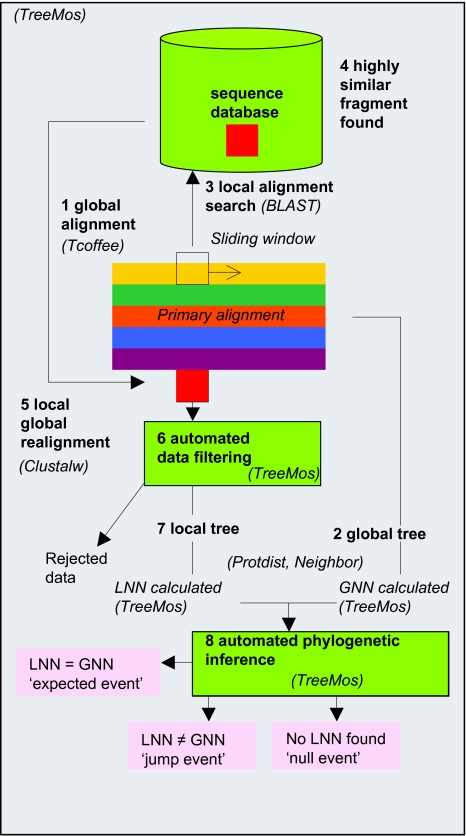
Figure 1.
Schematic overview of HTP analysis. The analysis begins with a global alignment (1) from which a global tree is calculated (2). A sliding window is then moved down the alignment. The sequence within each window is subject to a BLAST search against a sequence database (3). If a sequence fragment is found which with a very low genetic distance (4), then this sequence fragment is globally aligned to the window (5). The window alignment is screened and filtered for high distances (6), and a local tree calculated based on the remaining data (7). The nearest neighbour to each taxon is then compared between the local tree and the global tree (8). The possible event outcomes of the analysis are shown in pink boxes. The programs employed at each stage of the analysis are shown in brackets.

