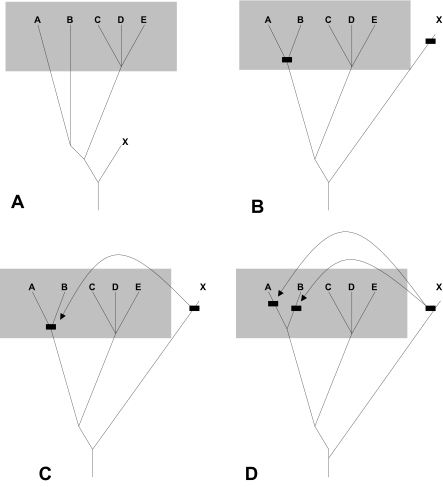
Figure 6.
Four phylogenetic models of correlated mosaicism. A monophyletic group is represented by taxa A–E. Taxa A and B display correlated mosaicism to distantly related taxon X. A. Deep branches within the group A–E result in both A and B being closest to X. B. At some point in the past indicated by boxes on the tree, the ancestor to A and B becomes so similar to the ancestor of X by chance homoplasy that both A and B appear closest to X. C. A recombination event between X and the common ancestor to A and B results in both taxa appearing to be closer to X than each other and C, D and E. D. Multiple recombination events between X and the A and B lineages respectively results in both taxa resembling X more than each other. Branch lengths are proportional to genetic distance.

