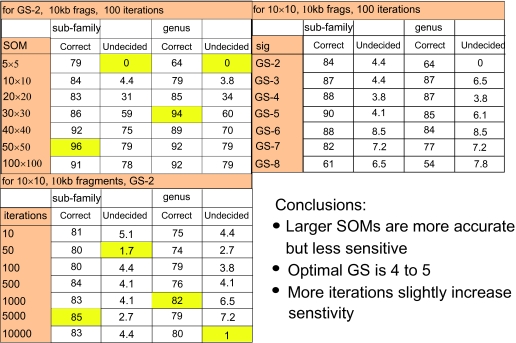
Figure 7.
Jack-knifing experiments to determine effects of SOM size (top left), GS number (top right) and number of iterations (lower left). The “undecided” column indicates the percentage of sequences in the test set that could not be assigned to a sub-family or genus. The “correct” column indicates the percentage of assignable sequences that were correctly assigned. Optimal values are highlighted in yellow.

