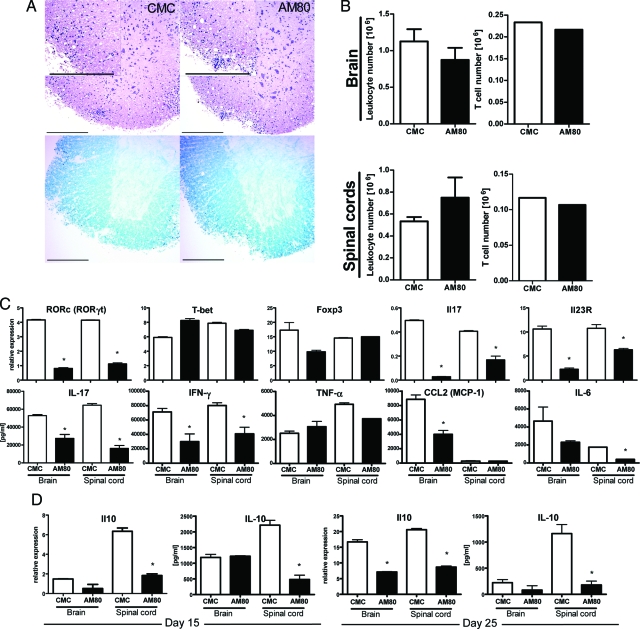
Figure 5.
Continuous AM80 treatment is less effective on EAE suppression with a differentially modulated cytokine profile. A: The H&E-stained sections and the Luxol fast blue-stained sections in EAE mice treated with or without AM80 are shown. The control animal (score 2) and AM80-treated animal (score 2) at day 25 were subjected to histological examination. Scale bar = 200 μm. B: Total leukocyte numbers and isolated T cell numbers from spinal cords were evaluated in animals that had received CMC or AM80 at day 25 after immunization. The upper row of C depicts purified T cells from B that were subjected to quantitative RT-PCR. Error bars represent duplicated PCR of the same samples. In the lower row of C, CNS-infiltrating T cells were restimulated with immobilized anti-CD3 mAb and cytokine or chemokine production in culture supernatants were assessed by ELISA or CBA after 72 hours. Error bars represent measurements from duplicate wells (*P < 0.001). D: IL-10 production by stimulated CNS-infiltrating T cells derived from CMC-treated or AM80-treated animals were assessed by either quantitative RT-PCR or CBA. CNS-infiltrating T cells were isolated at day 15 or day 25 after EAE induction. B is a representative of four independent experiments; A, C, and D of two with six animals per group.

