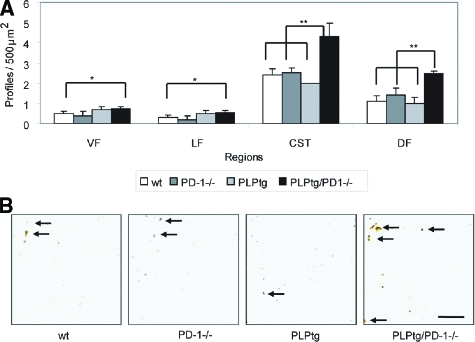
Figure 3.
PLPtg/PD-1−/− mice show elevated numbers of dephosphorylated neurofilament in the spinal cord. A: Quantification of nonphosphorylated neurofilament in the cervical spinal cord of wild-type (wt), PD-1, PLPtg, and PLPtg/PD-1−/− mice (n = 3 to 4). Investigated areas include ventral funiculus (VF), lateral funiculus (LF), corticospinal tract (CST), and dorsal funiculus (DF). B: Representative examples of SMI32+ swollen axonal profiles in the spinal cord (arrows). Error bars represent standard deviations. *P < 0.05, **P ≤ 0.01. Scale bar = 10 μm.

